Workbench Dashboard
The Workbench Dashboard gives a live overview of your built application without leaving VS Code: build summary, memory usage, Kconfig values, device tree and more. It lives in the "Zephyr Dashboard" panel at the bottom of the VS Code window.
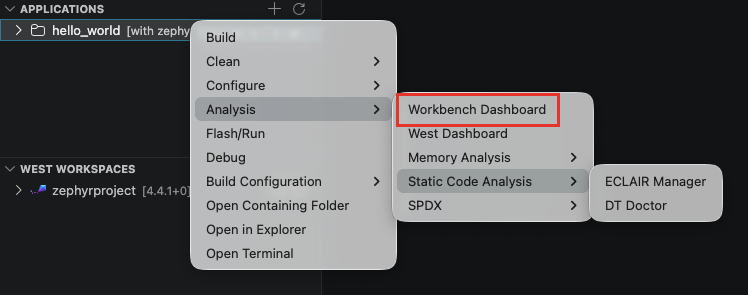
To open it, use one of:
- Right-click on the application > Analysis > Workbench Dashboard
- The command palette: "Zephyr Workbench: Workbench Dashboard"
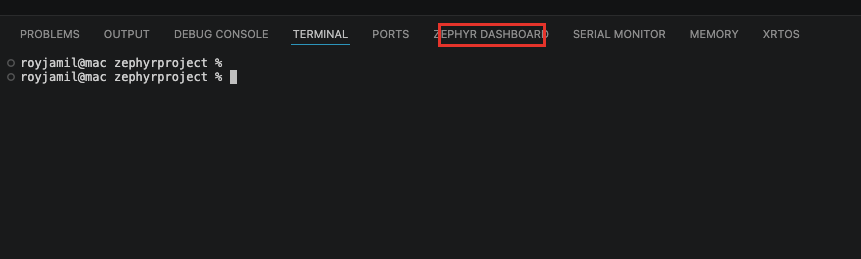
- The "Zephyr Dashboard" tab in the bottom panel, next to the Terminal
Once opened, the dashboard stays available as the "Zephyr Dashboard" tab in the bottom panel, alongside Terminal and Output.
The dashboard reads the build artifacts, so the application must be built first. The dashboard follows the active editor: open a file of the application you want to inspect, and it switches to that application automatically.
The header shows the current App, Cfg (build configuration) and Board, plus a few key metrics for the active tab. Every tab except Summary has a search box to filter its content. After a rebuild, click the refresh icon in the view title bar ("Refresh Workbench Dashboard") to reload the data.
Summary
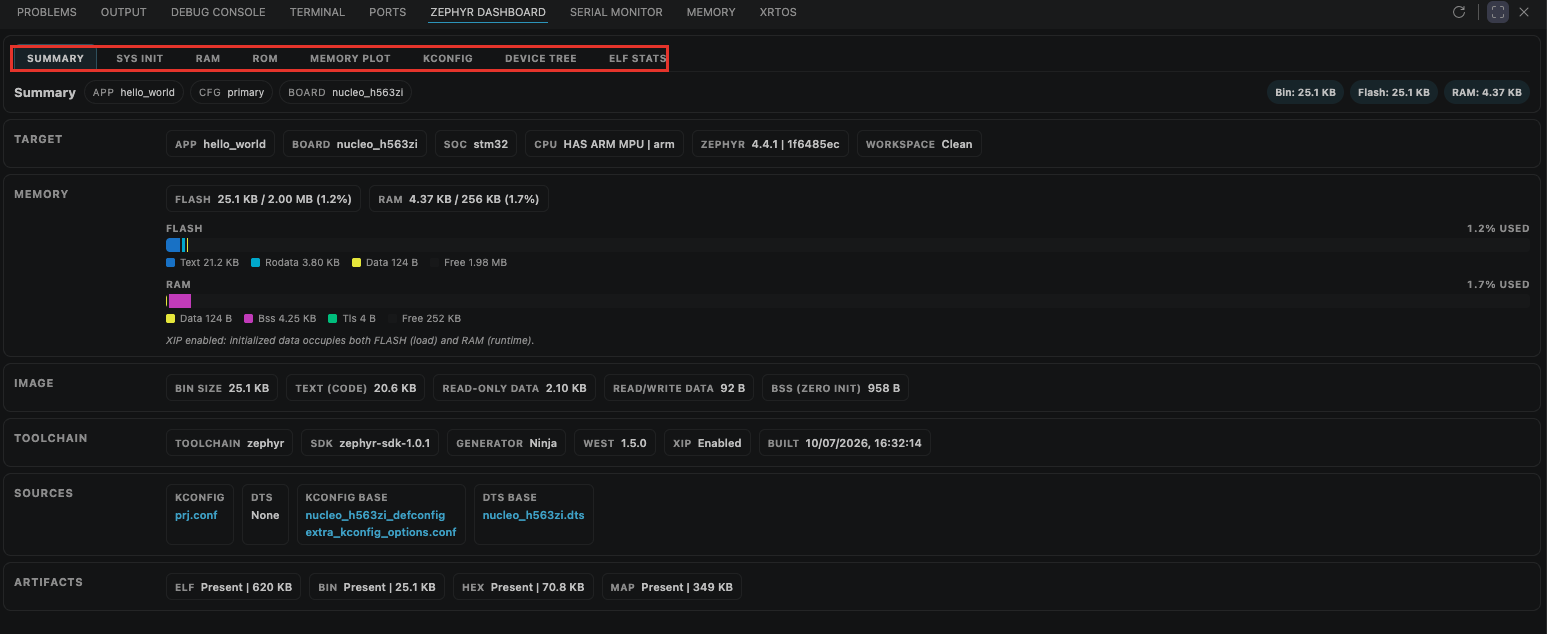
The Summary tab shows six cards:
- Target: application, board, SoC, CPU, Zephyr version, and whether the workspace is clean or dirty.
- Memory: Flash and RAM usage as "used / capacity", with usage bars broken down by section (text, rodata, data, bss...).
- Image: binary size, code, read-only data, read/write data and BSS.
- Toolchain: toolchain, SDK, generator, West version and build date.
- Sources: the Kconfig and DTS files that shaped this build. Click a file to open it.
- Artifacts: the generated build files (ELF, BIN, HEX, MAP...) and their sizes.
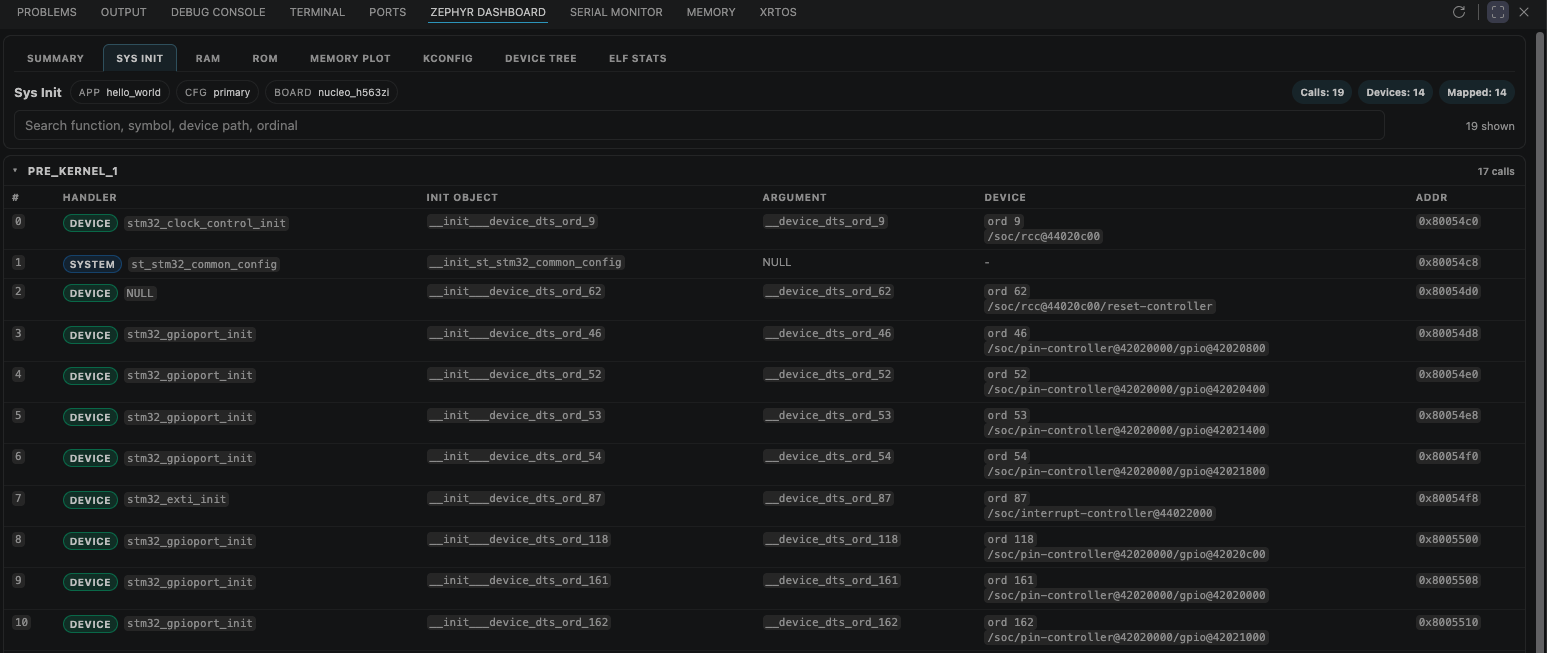
Sys Init
Lists every system initialization call of the image, grouped by init level. Each entry shows the handler, the init object, and the device it initializes when there is one. Use the search box to find a function, symbol, device path or ordinal.
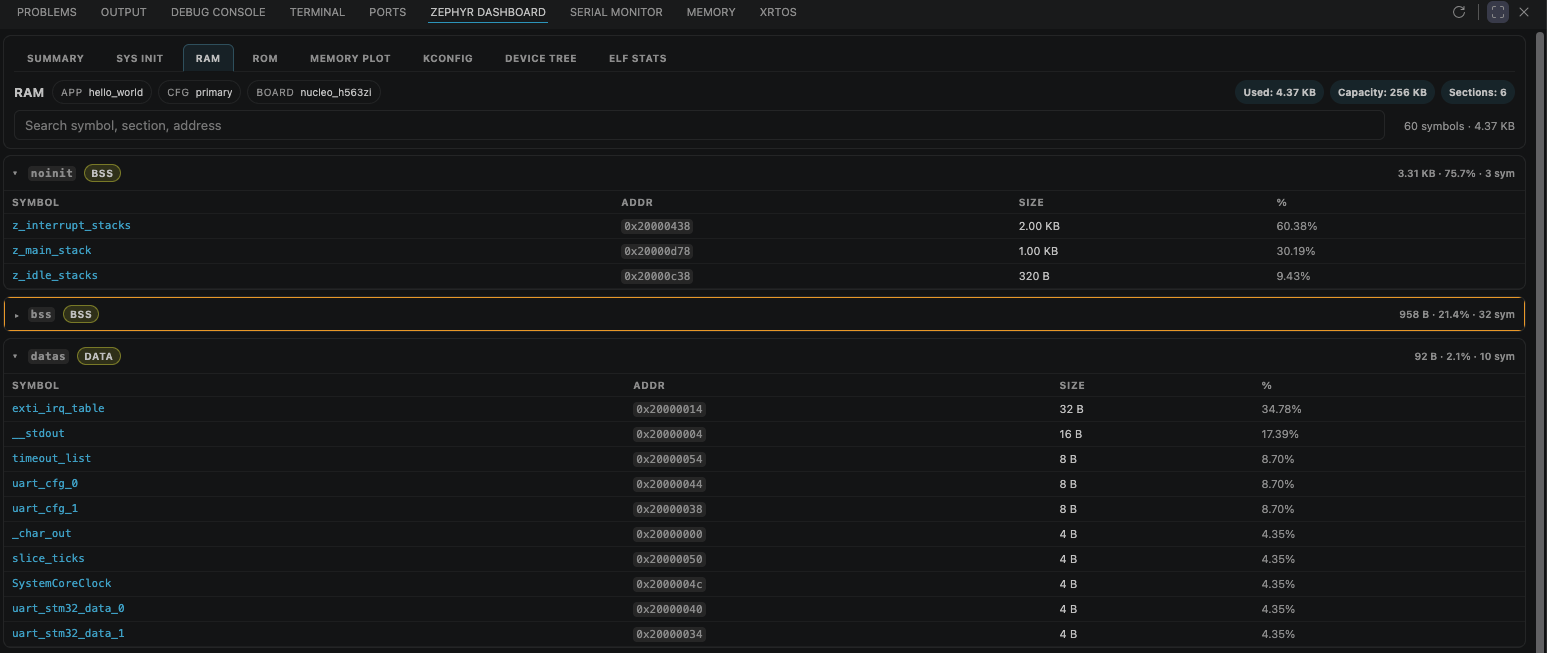
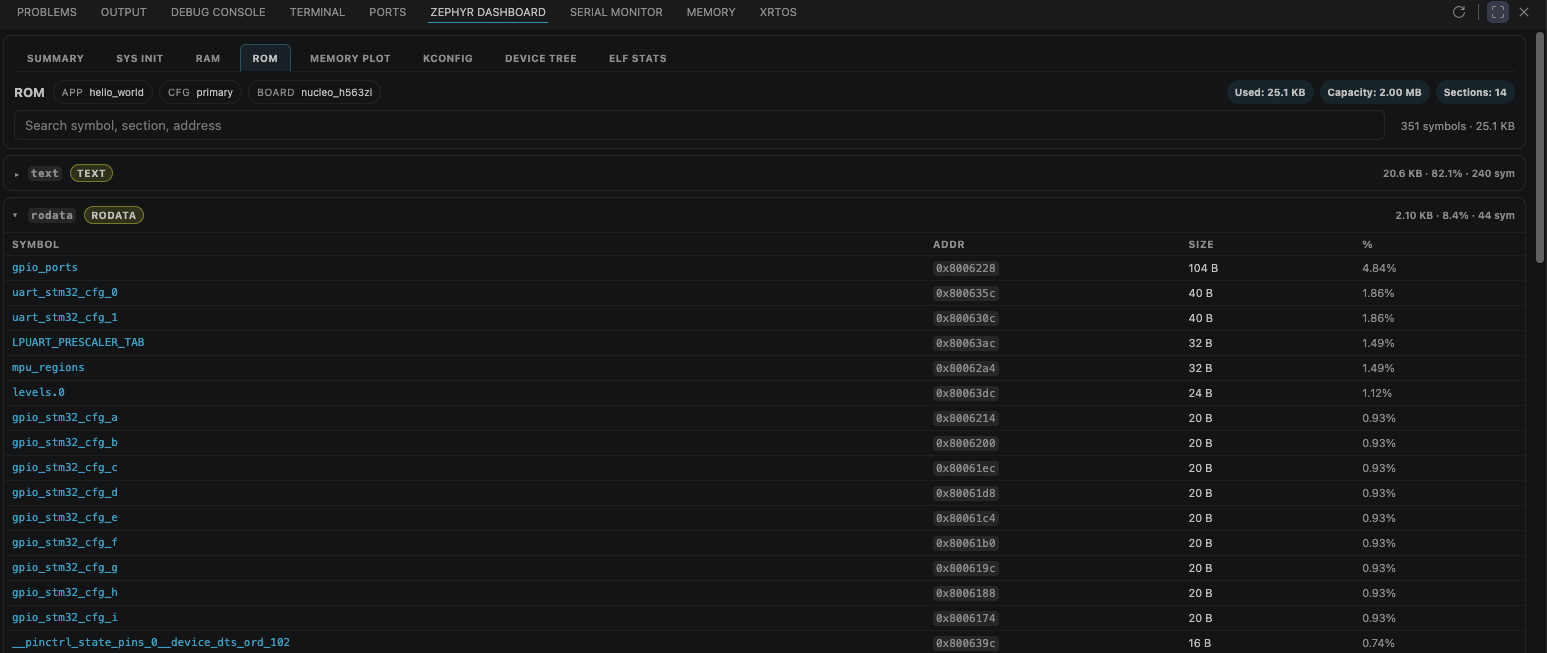
RAM and ROM
Per-section breakdown of RAM and ROM usage. Each section expands into a symbol table with address, size and percentage. Click a symbol name ("Go to declaration") to jump to its definition in the source code.
For the terminal equivalents, see RAM Report and ROM Report.
Memory Plot
An interactive sunburst chart of memory usage, grouped by source path. Use the RAM / ROM toggle to switch between the two memory areas. Click a wedge to zoom in, click the center to go up. The details panel shows the size, share and section of the selected item, with "Go to declaration" and "Zoom here" actions. Searching dims the wedges that do not match.
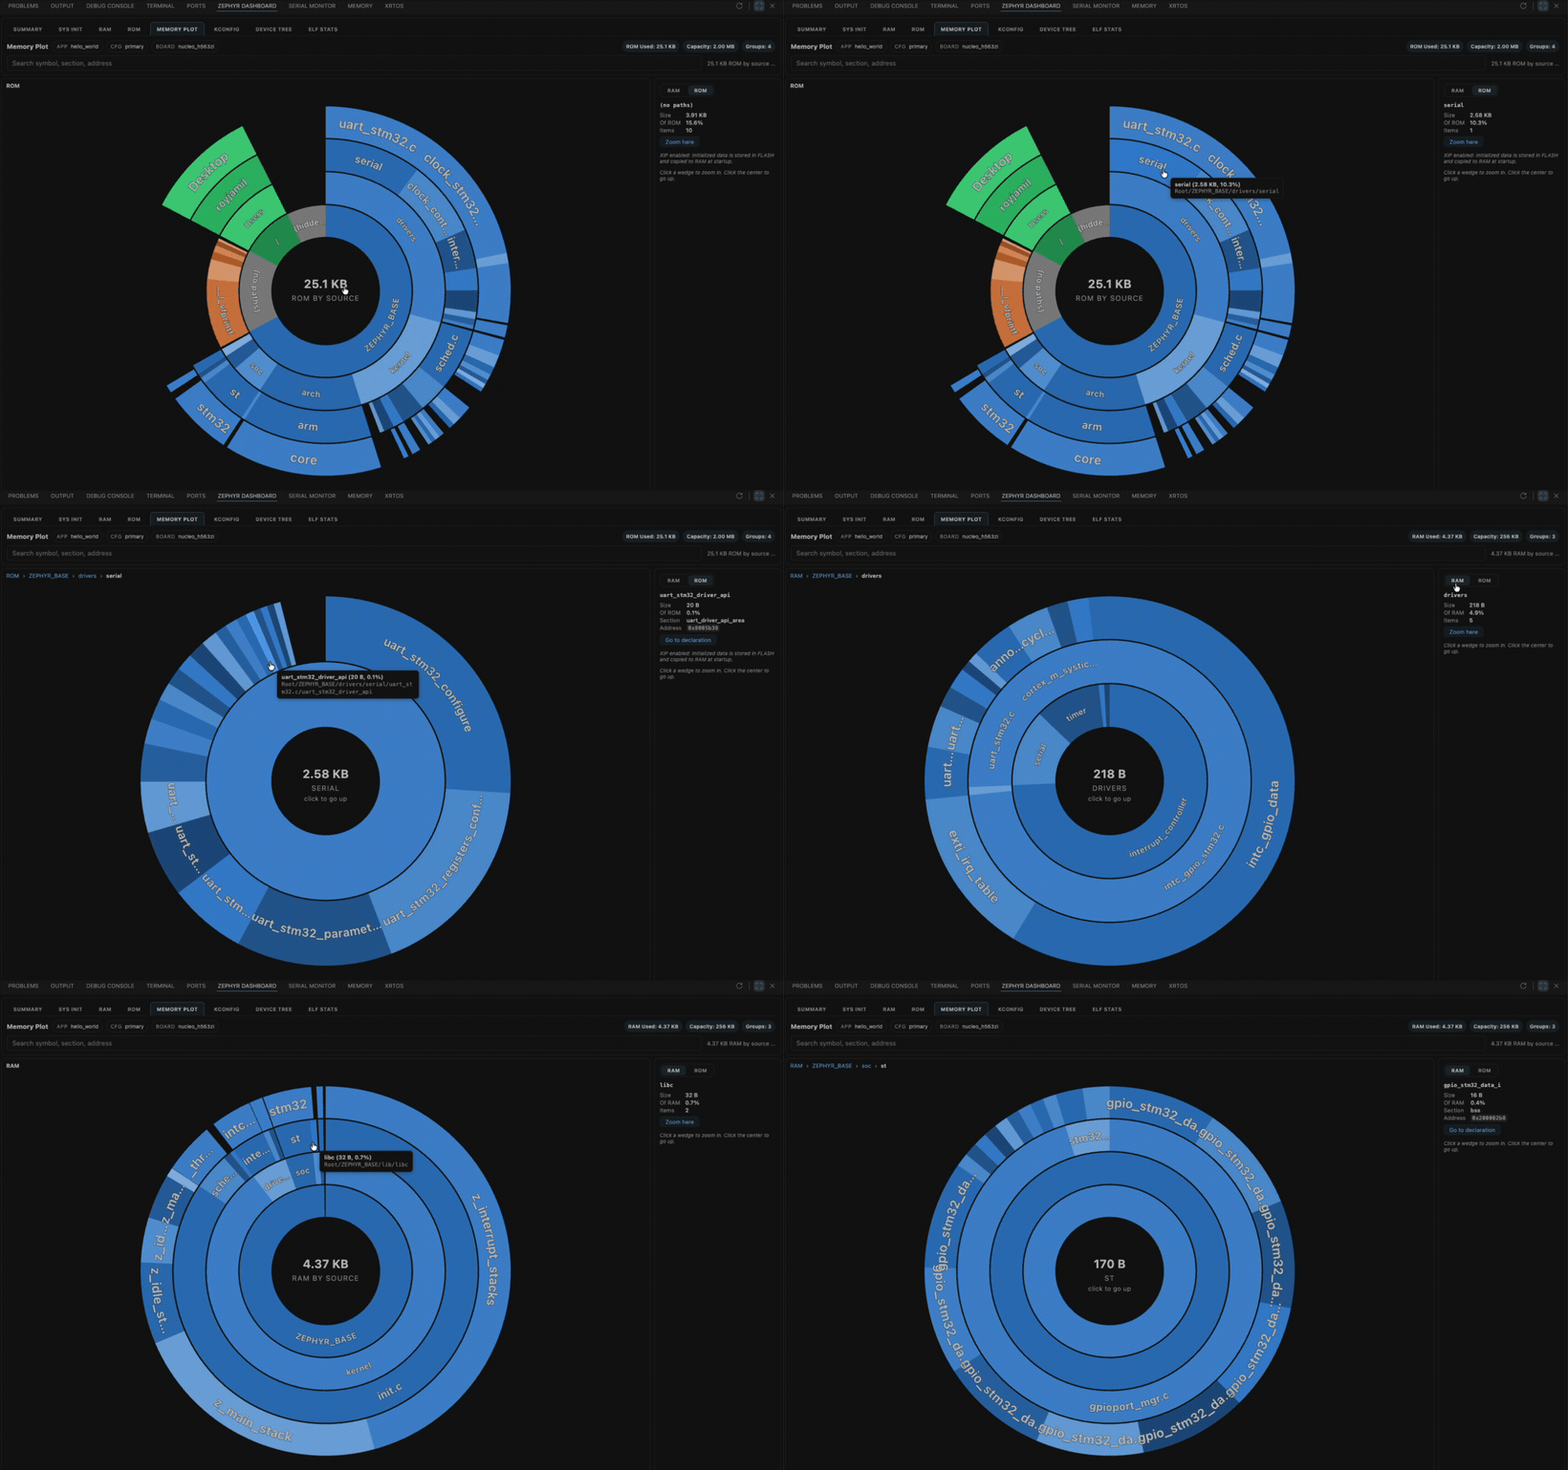
The same visualization is available in the browser through RAM Plot and ROM Plot.
Kconfig
A searchable table of every Kconfig symbol of the build: type, name, value, source and origin. Badges tell you where a value comes from: "default", "assigned", "selected" or "implied". The Origin column links to the exact file and line that set the value. Click it to open the file.
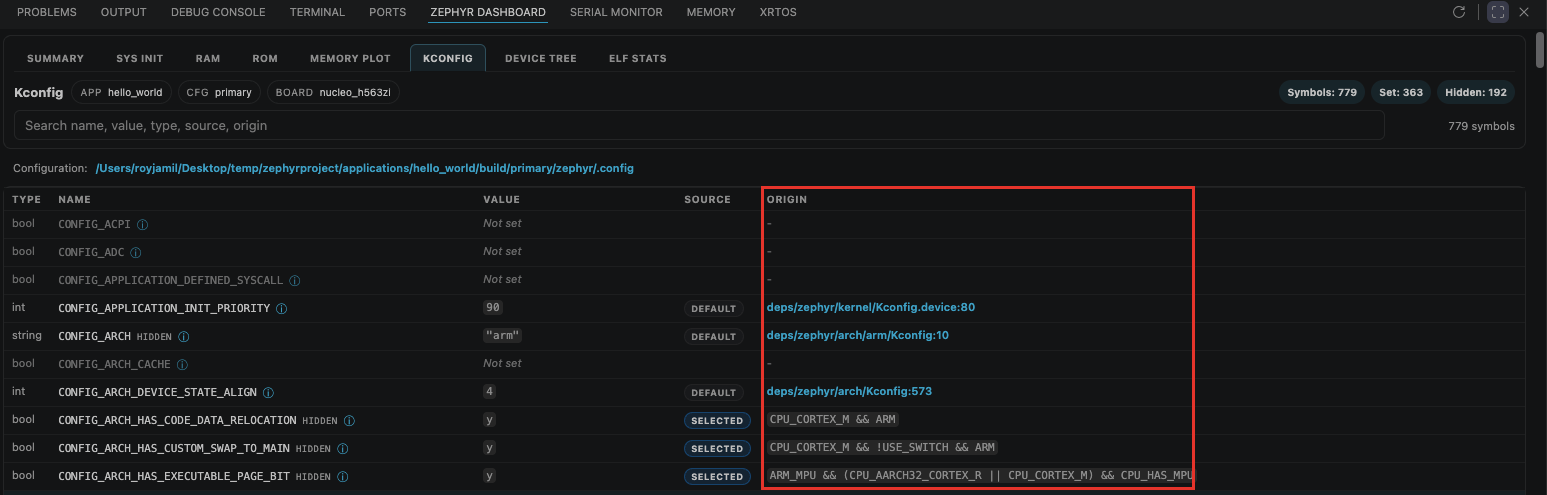
The full detail (type, source badges, Origin links) needs the build's Kconfig trace: recent Zephyr versions write a .config-trace.json file next to .config during the build. On older versions the tab falls back to the plain .config content.
To edit the configuration instead of inspecting it, use the Kconfig Manager.
Device Tree
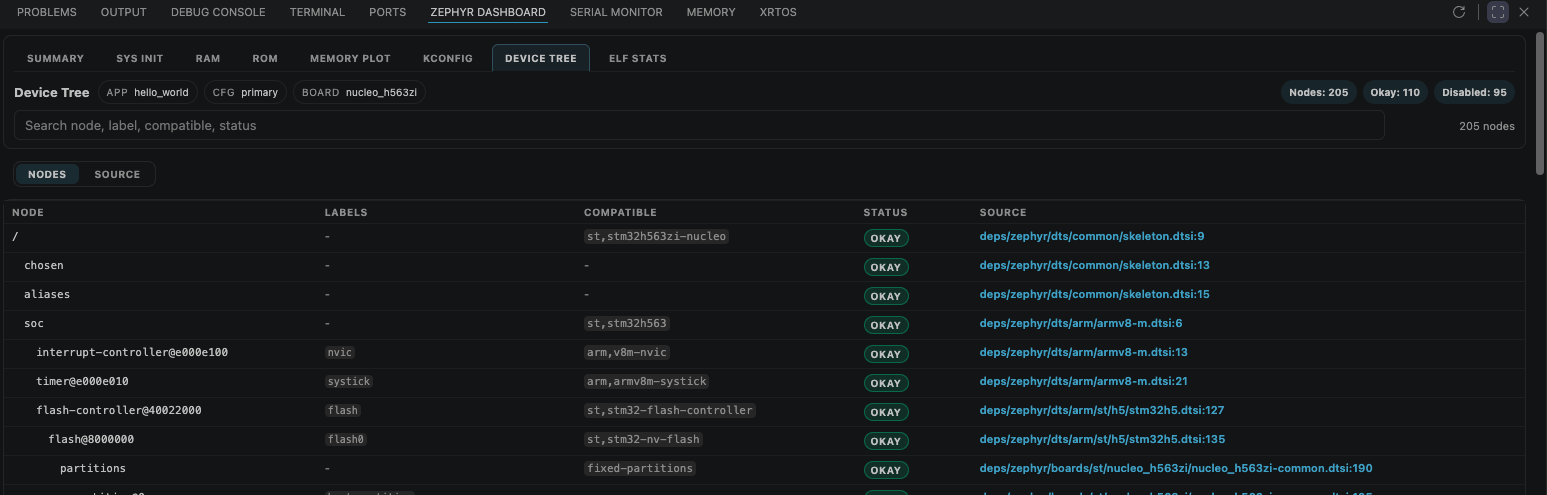
The final device tree of the build. The "Nodes" view is a table of all nodes with their labels, compatible strings, and status (okay or disabled); click a source location to open the file. The "Source" view shows the generated zephyr.dts with search highlighting.
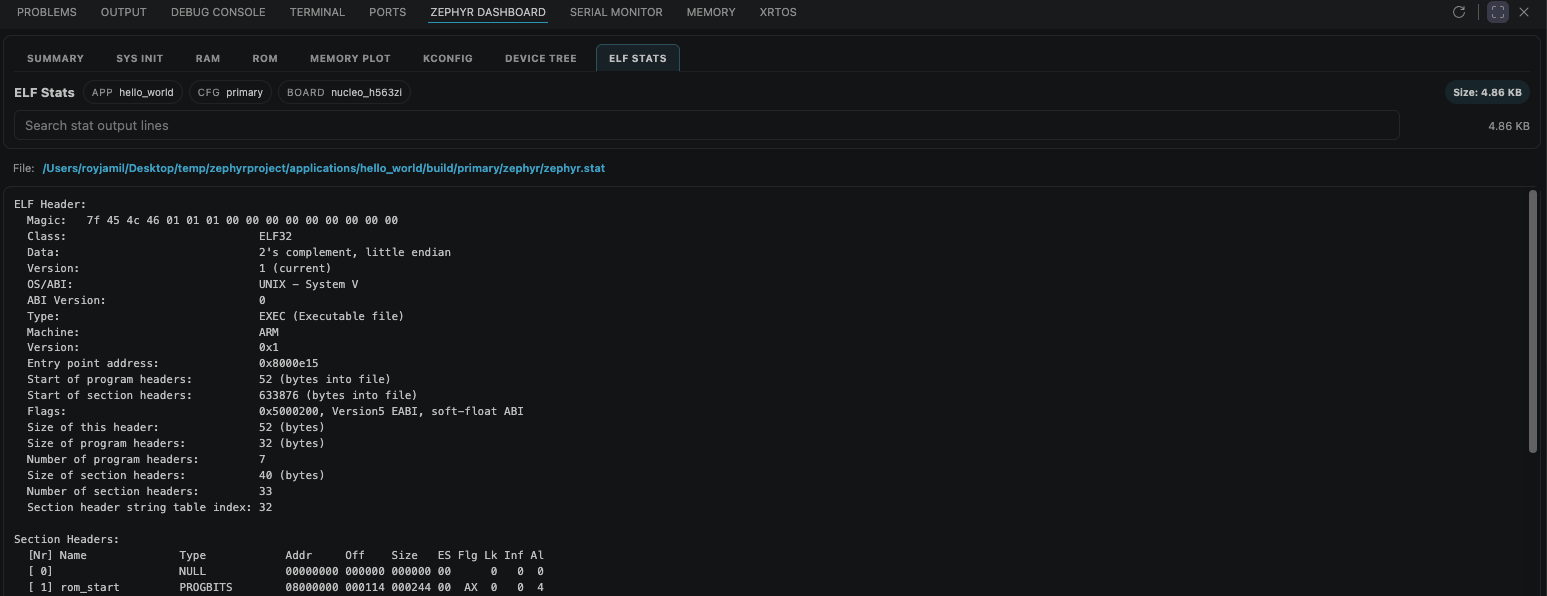
ELF Stats
Statistics extracted from the generated ELF file (the zephyr.stat build artifact). Use the search box to filter the output lines.