West Dashboard
The West Dashboard is a web page generated by the Zephyr build system that summarizes the application and its build: build attributes, memory reports, Kconfig data, system initialization, device tree information and ELF statistics.
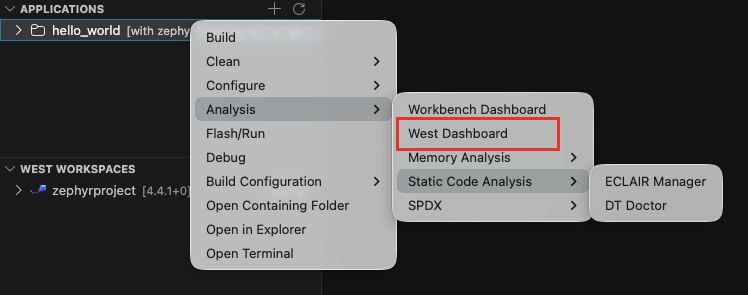
To open it, right-click on the application > Analysis > West Dashboard.
The command runs west build -t dashboard in the terminal, then opens the generated page in your default browser.
The main page shows the build summary: Zephyr version, board, application path, build date and toolchain, plus the memory summary and the build command. The other pages are Memory Report, Kconfig, Sys Init, Device Tree and ELF Stats.
The dashboard build target is provided by recent Zephyr versions. On a Zephyr version without it, or if the build fails, the page is not produced and a warning appears: "Dashboard not generated: ... not found." Update the workspace to a newer Zephyr revision to use this feature.
For the same kind of information inside VS Code, without leaving the editor, use the Workbench Dashboard.