RAM Plot
The RAM Plot shows the application RAM usage as an interactive hierarchical chart in your browser. Each element's size is proportional to its memory usage, which makes large RAM consumers easy to spot.
To run it, right-click on the application > Analysis > Memory Analysis > RAM Plot.
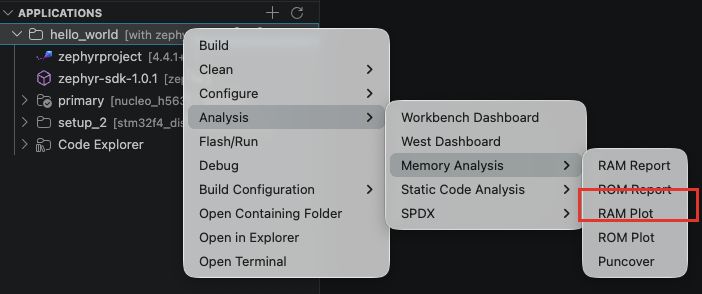
The command runs west build -t ram_plot in the terminal. It starts a local web server and opens the plot page in your default browser. Navigate the hierarchy by clicking the chart elements: kernel, drivers, libraries, application data and dependencies each appear as their own branch.
The server keeps running while you browse the plot. To stop it, click the "Terminate" button on the bottom-right notification ("RAM Plot server is running...").
The notification may disappear after a short time. To display it again, click the notification bell button in the status bar.
The Workbench Dashboard Memory Plot tab shows a similar interactive chart directly inside VS Code, without starting a server. For a plain table in the terminal, use the RAM Report.