Getting Started on Linux
This tutorial walks you through Workbench for Zephyr on Linux. You will set up the Zephyr environment, create your first "hello_world" application for the STM32F4 Discovery board from the latest official Zephyr sources, then build, flash and debug it.
If you prefer a video walkthrough, see the Getting Started Video Tutorial.
Setting Up the Zephyr environment
Install Host Tools
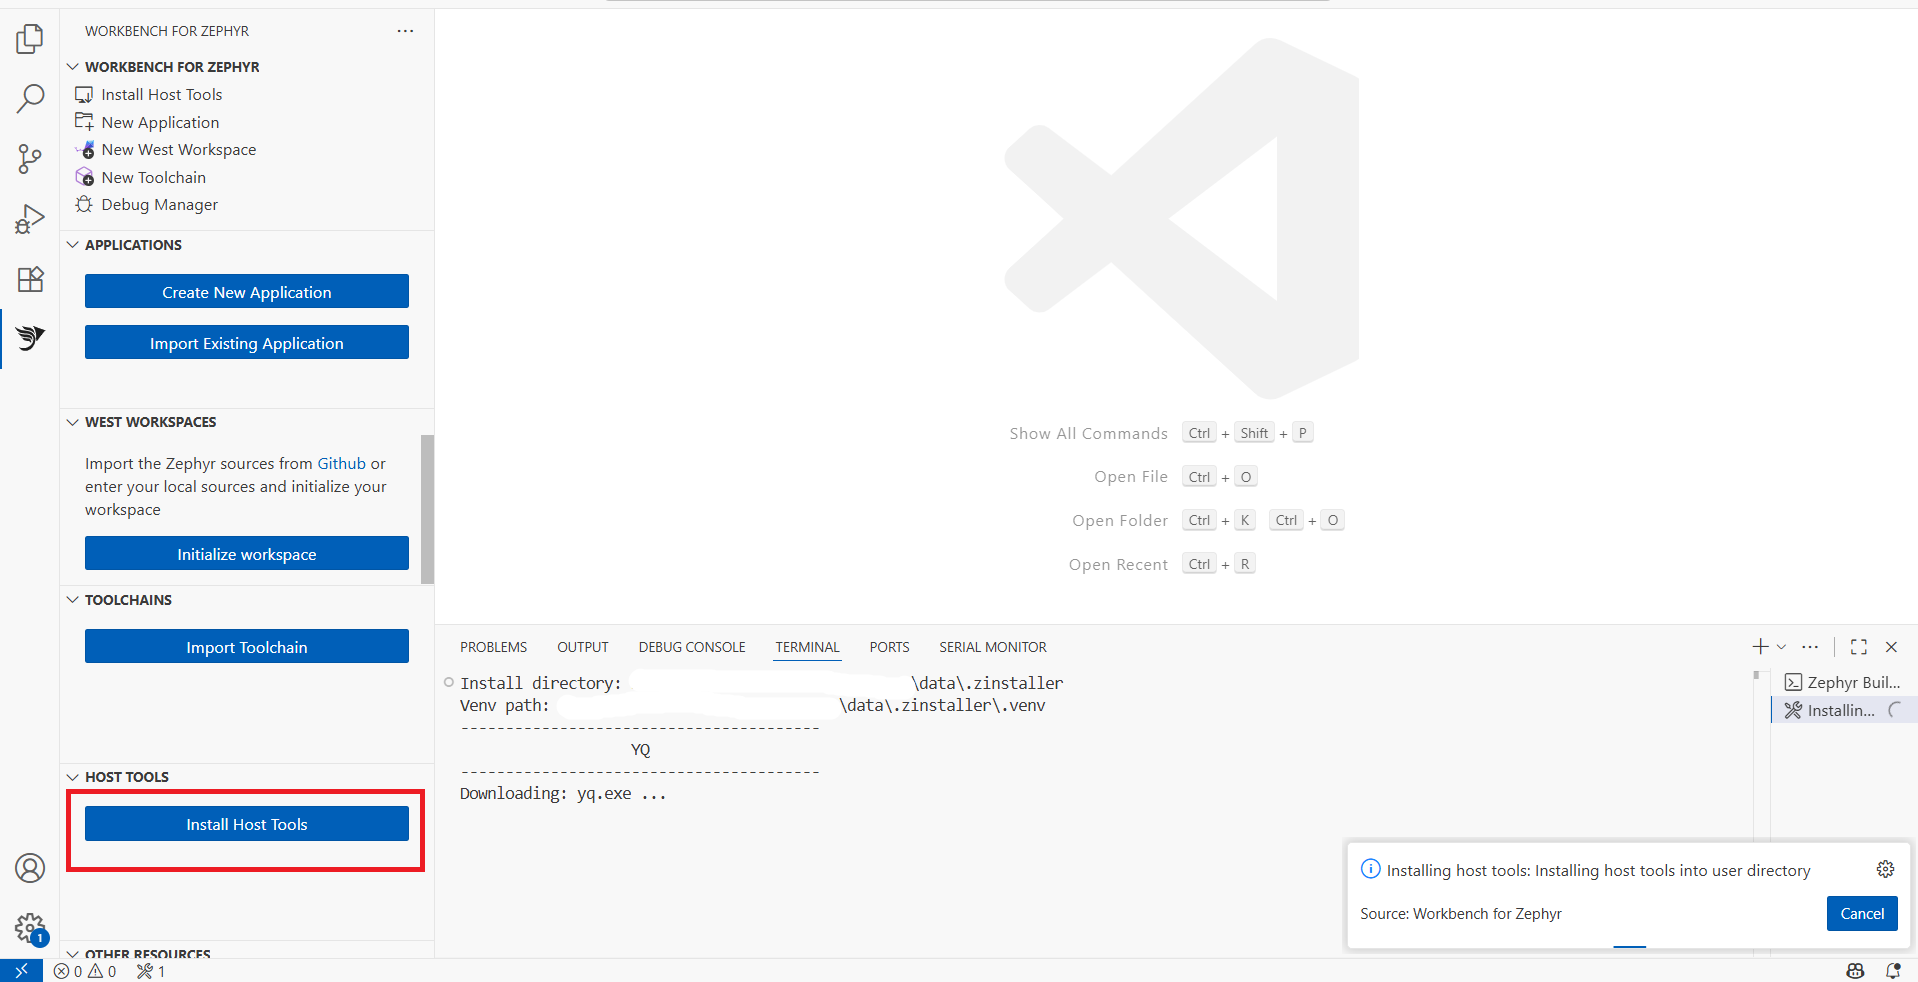
- Click on "Workbench for Zephyr" in the VS Code activity bar
- Click on "Install Host Tools" to download and install the native tools locally (takes a few minutes)
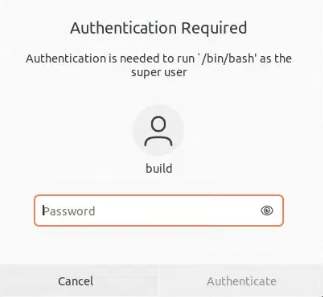
This step installs several distribution packages (git, gperf, dtc, gcc, make, ccache, dfu-util, wget, xz, file, SDL2, hidapi, libmagic, unzip and Python support packages) using your system's package manager. Your sudo password is asked to perform the installation. If the listed tools are already installed on your system, just cancel when the password prompt is shown.
- This step also installs portable versions of tools required by the Zephyr build system (Python, CMake, Ninja)
- It creates a Python virtual environment with the Zephyr requirements and installs OpenOCD as the default runner
To choose the Python interpreter or install only some of the tools, use "Install Host Tools (Advanced)" instead. See Advanced Host Tools.
Add Toolchain
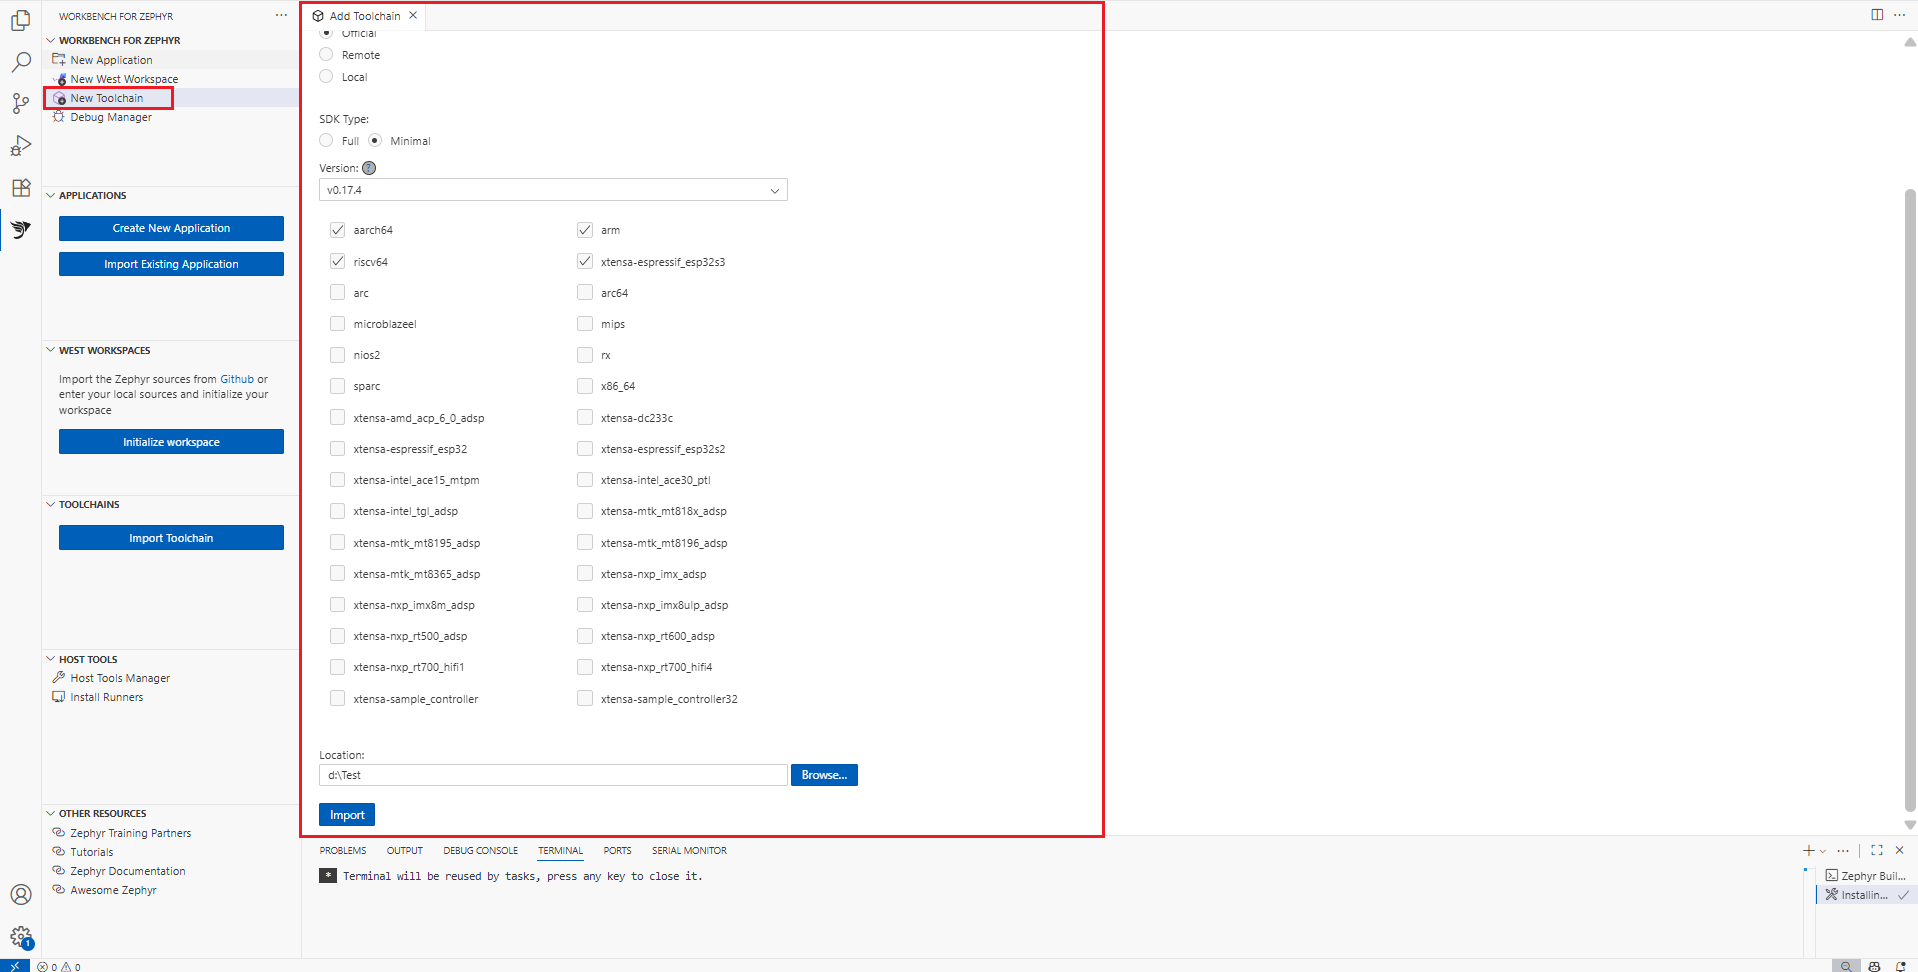
- Click on "Add Toolchain"
- Keep "Toolchain family:" set to "Zephyr SDK" and "Source:" set to "Official"
- Choose the destination:
- "Custom location": the SDK is imported under the folder you pick in "Location:"
- "Global (auto-discovered)": the SDK is installed in a standard location that the Zephyr build system discovers automatically
- SDK Type: keep "Full" to get every toolchain, or select "Minimal" and check only the toolchains you need (for example "arm" for STM32 boards)
- Version: keep the latest release (preselected)
- Click on "Import"
Add a West Workspace
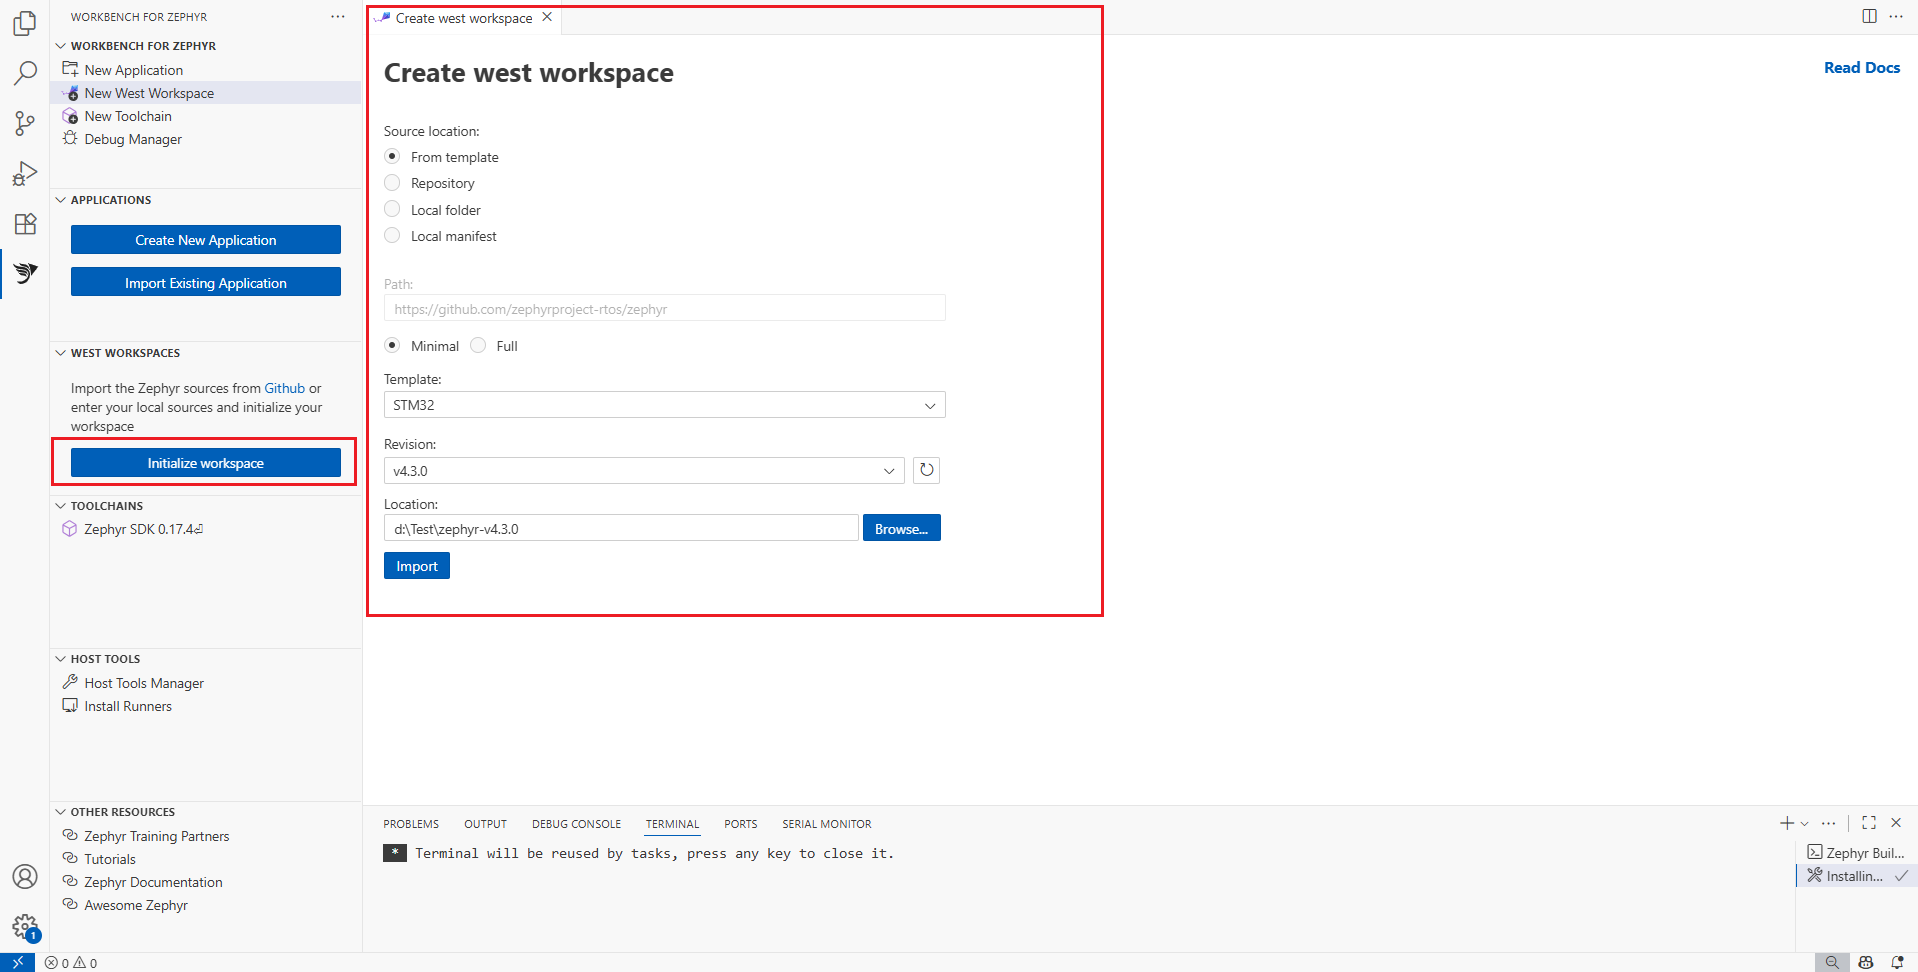
- Click on "Add West Workspace"
- Keep "Source location:" set to "From template"
- Keep "Minimal" selected and pick the "STM32" template ("Minimal" fetches only the modules the template needs, "Full" imports every Zephyr module)
- Revision: select the Zephyr version to work with (the latest tag is preselected)
- Under "Advanced options", "Fetch west blobs" is checked by default: it downloads the vendor binary blobs (for example HAL firmware) once the workspace is ready
- Location: choose the parent folder for the workspace
- Subfolder: name of the workspace folder created under the Location (default "zephyrproject")
- Click on "Import"
Initializing then updating the workspace downloads the Zephyr sources and modules. It can take around 10 minutes.
Creating and building the project
Add an Application
On Workbench for Zephyr, new projects are based on samples from the Zephyr sources.
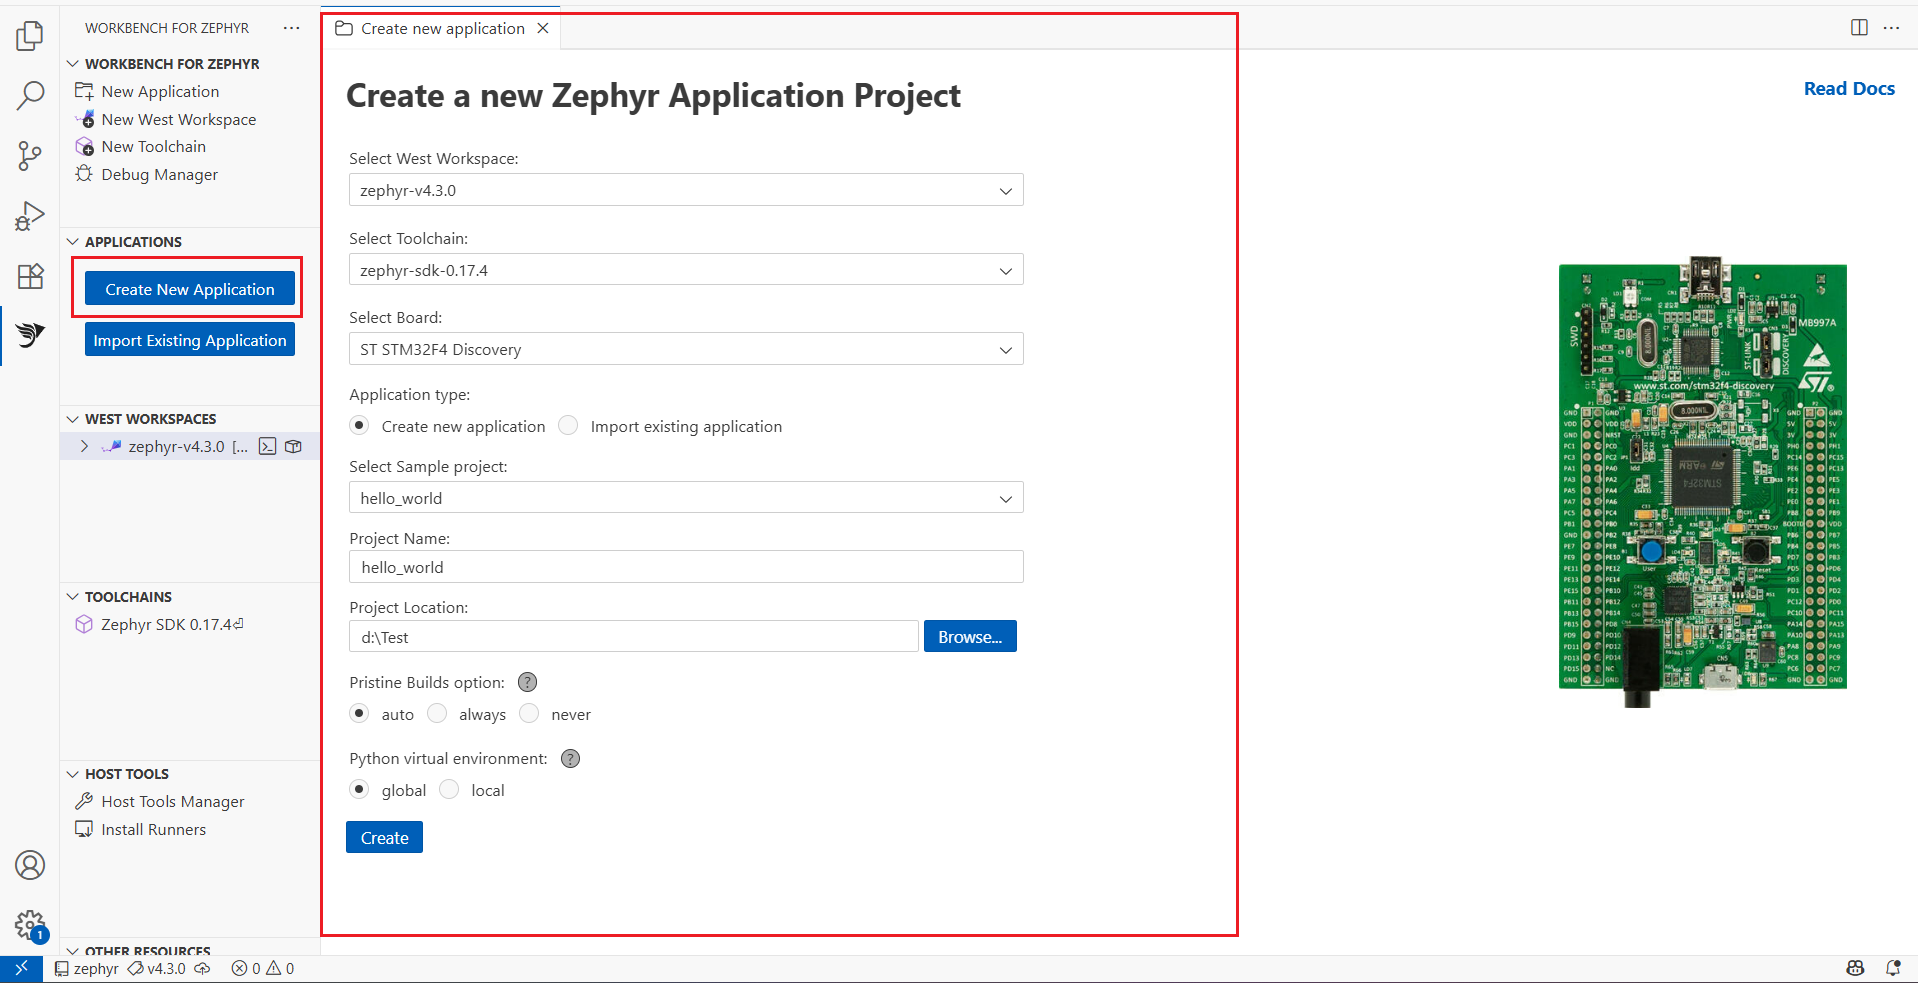
- Click on "Add Application"
- Select the West Workspace to attach to
- Select the Toolchain to use
- Select the target Board (e.g. ST STM32F4 Discovery)
- Keep "Create new application" selected
- Select the template (e.g. hello_world)
- Enter the project name
- Application type: keep "West workspace application" to create the project inside the workspace, or select "Freestanding application" to create it anywhere on disk
- Keep the "Debug preset" checkbox checked: it enables debug-friendly options in prj.conf
- Click on "Create"
Edit your code
To edit the project sources, go back to the "Explorer" panel.
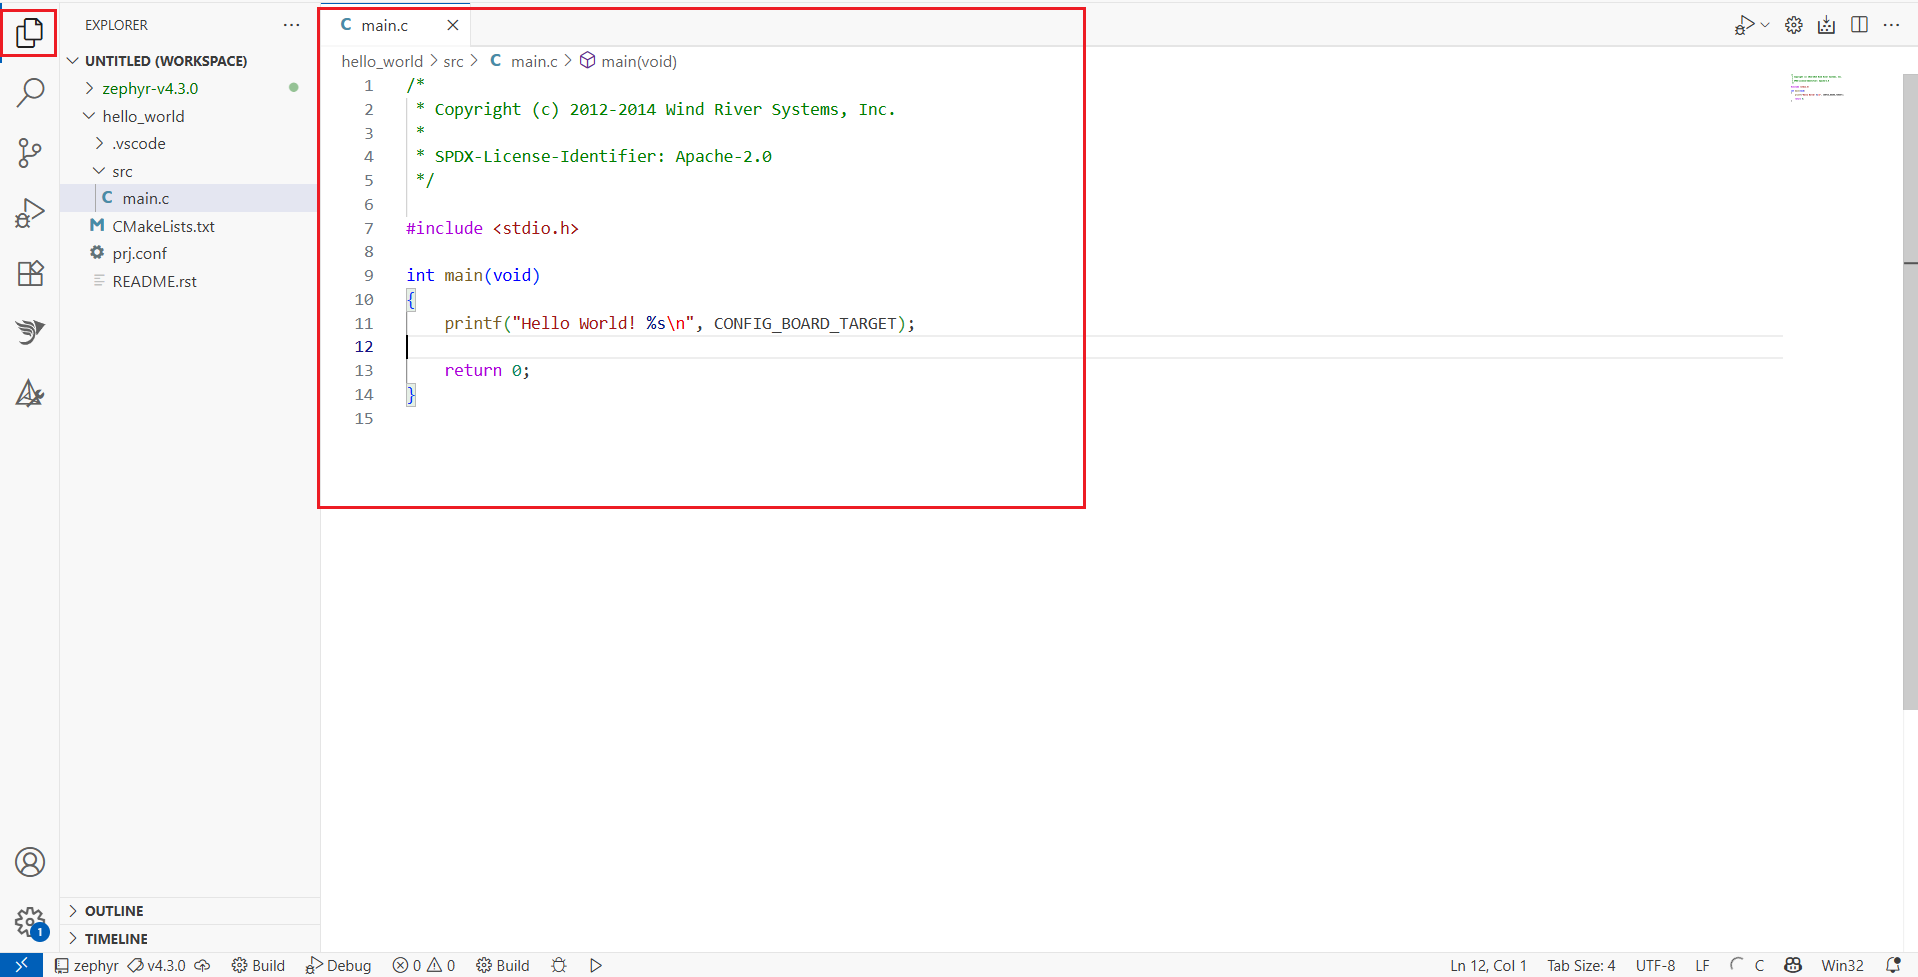
To jump from the "Workbench for Zephyr" panel to your project in the "Explorer", right-click on the application > Open in Explorer.
Build the application
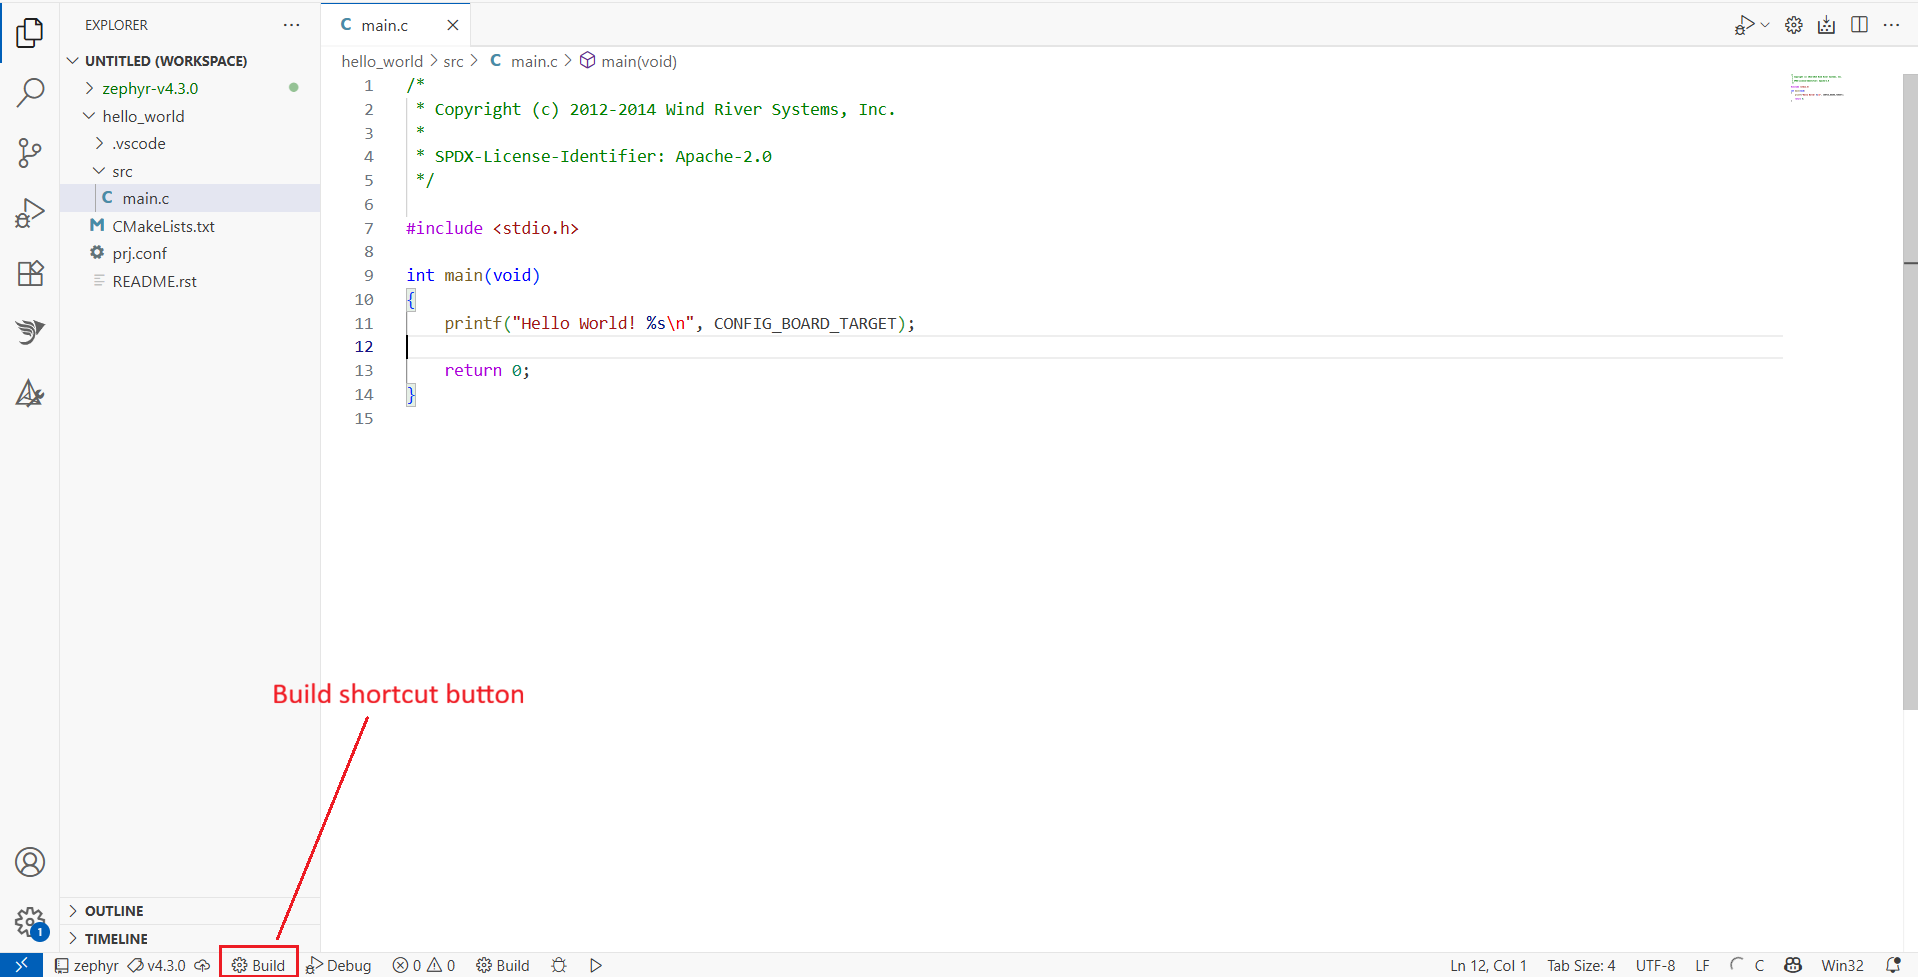
- Click on the "Build" button in the status bar below.
- Alternatively, press Ctrl+Shift+B then select the folder to build.
- The build output is displayed in the Terminal
Running the application
Flash the application
- Connect the board to your computer over USB
- Hover over the application in the "Applications" view and click on the inline "Flash" button
- Alternatively, right-click on the application > Flash/Run
- The "West Flash" task runs
west flashin the terminal and programs the board with the default runner (OpenOCD was installed with the host tools)
On Linux, udev rules are required to access the debug probe as a regular user. Install the STM32 pack from Install Runners: it includes "Udev Rules for STLink, JLink and libUSB". Unplug and replug the board afterwards.
View the serial output
The hello_world sample prints a message on the board's serial console.
- The Serial Monitor extension is installed together with Workbench for Zephyr
- Open the "Serial Monitor" tab in the bottom panel, next to the Terminal
- Select the serial port of your board (the on-board probe exposes it as a USB serial device, for example
/dev/ttyACM0) - Keep the default baud rate of 115200 and start monitoring
- Press the reset button on the board, the output appears:
*** Booting Zephyr OS build vX.Y.Z ***
Hello World! stm32f4_disco/stm32f407xx
Debugging the application
Install Runners
Runners are the host tools used to flash and debug your board. OpenOCD is installed automatically with the host tools. Install the vendor tools for your target if you need them:
- Click on "Install Runners" to open the runners manager
- Click on the Install icon of the STM32 pack: it installs STM32CubeCLT, OpenOCD, J-Link and the udev rules
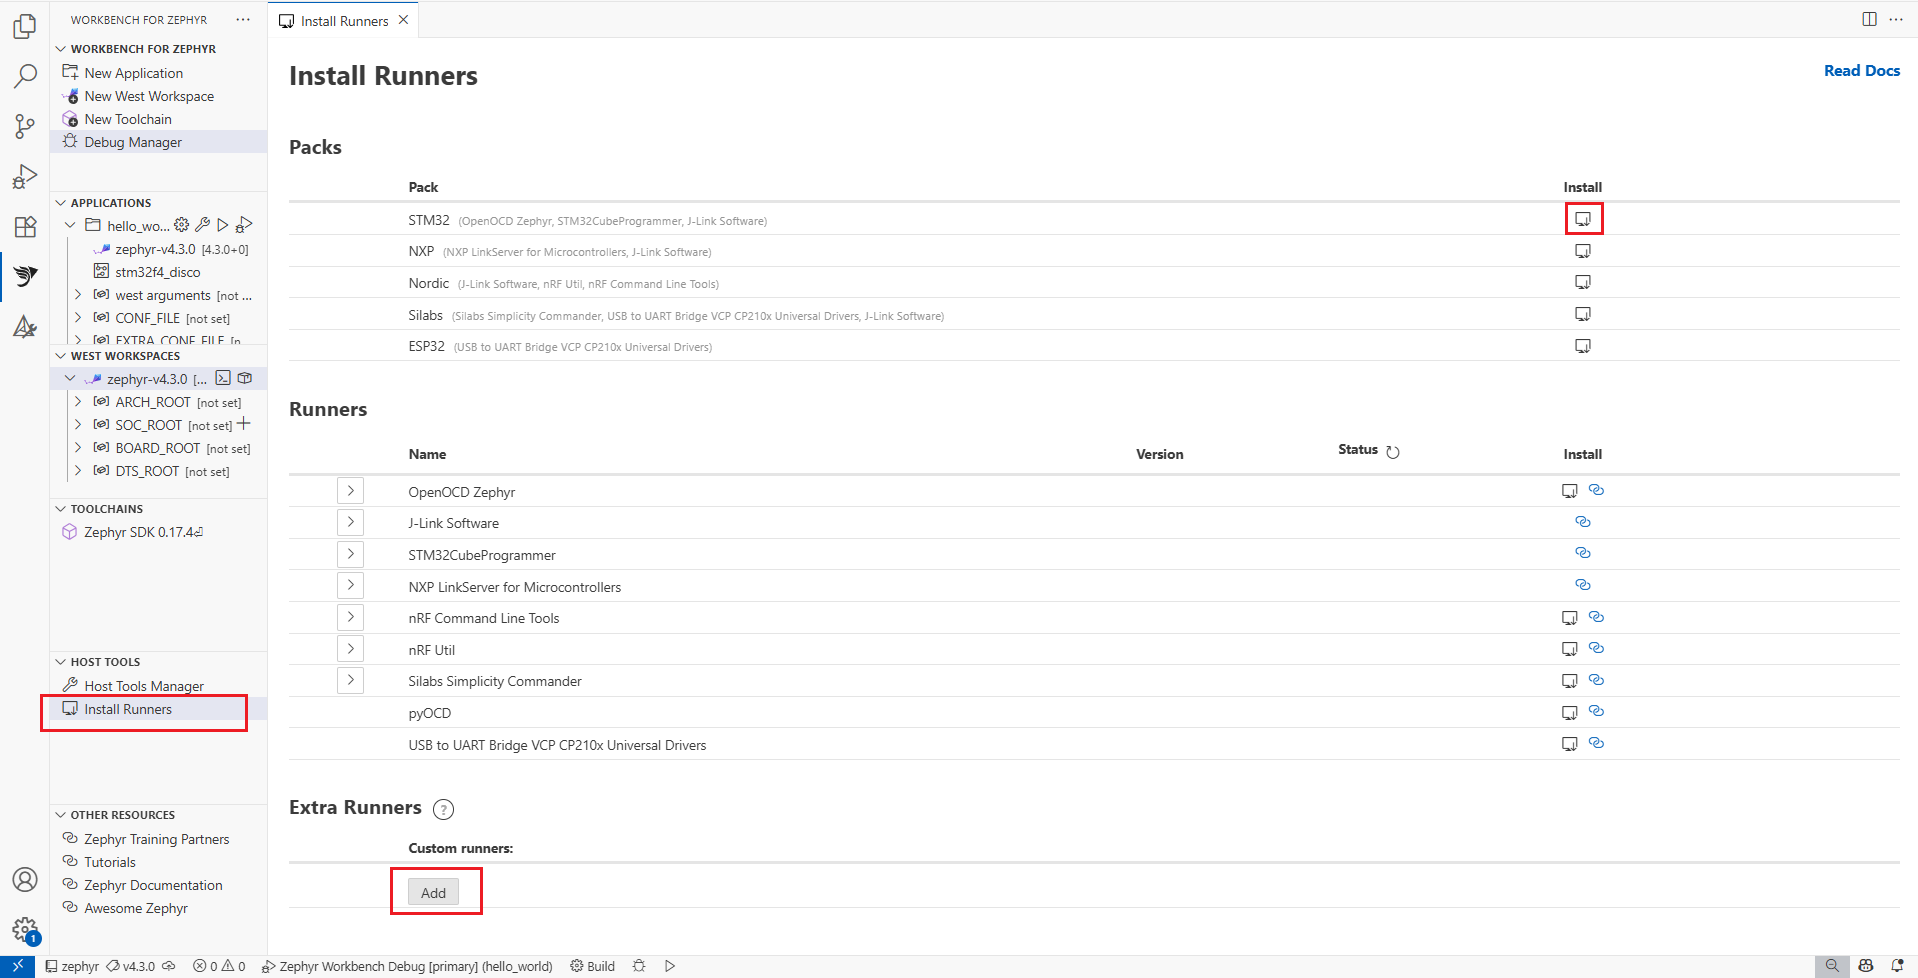
In Extra Runners, you can add a custom runner if you prefer.
Configure the debug session
- Click on "Debug Manager" to open the debug configuration form
- Select the application to debug, then select the build configuration. The other settings are filled automatically from the build.
- Debug Backend: keep "C/C++ Debug (cppdbg)" (the default). The two "Cortex-Debug" backends are described in Debug Session.
- Select the runner: runners detected for your board are marked "(compatible)", and a green line below confirms the selected runner is installed
- If needed, adjust the Program Path (by default, the zephyr.elf image under the build directory), the SVD File, the GDB settings or the additional arguments
- Press Apply to save the configuration into the .vscode/launch.json or Debug to apply then run the debug session
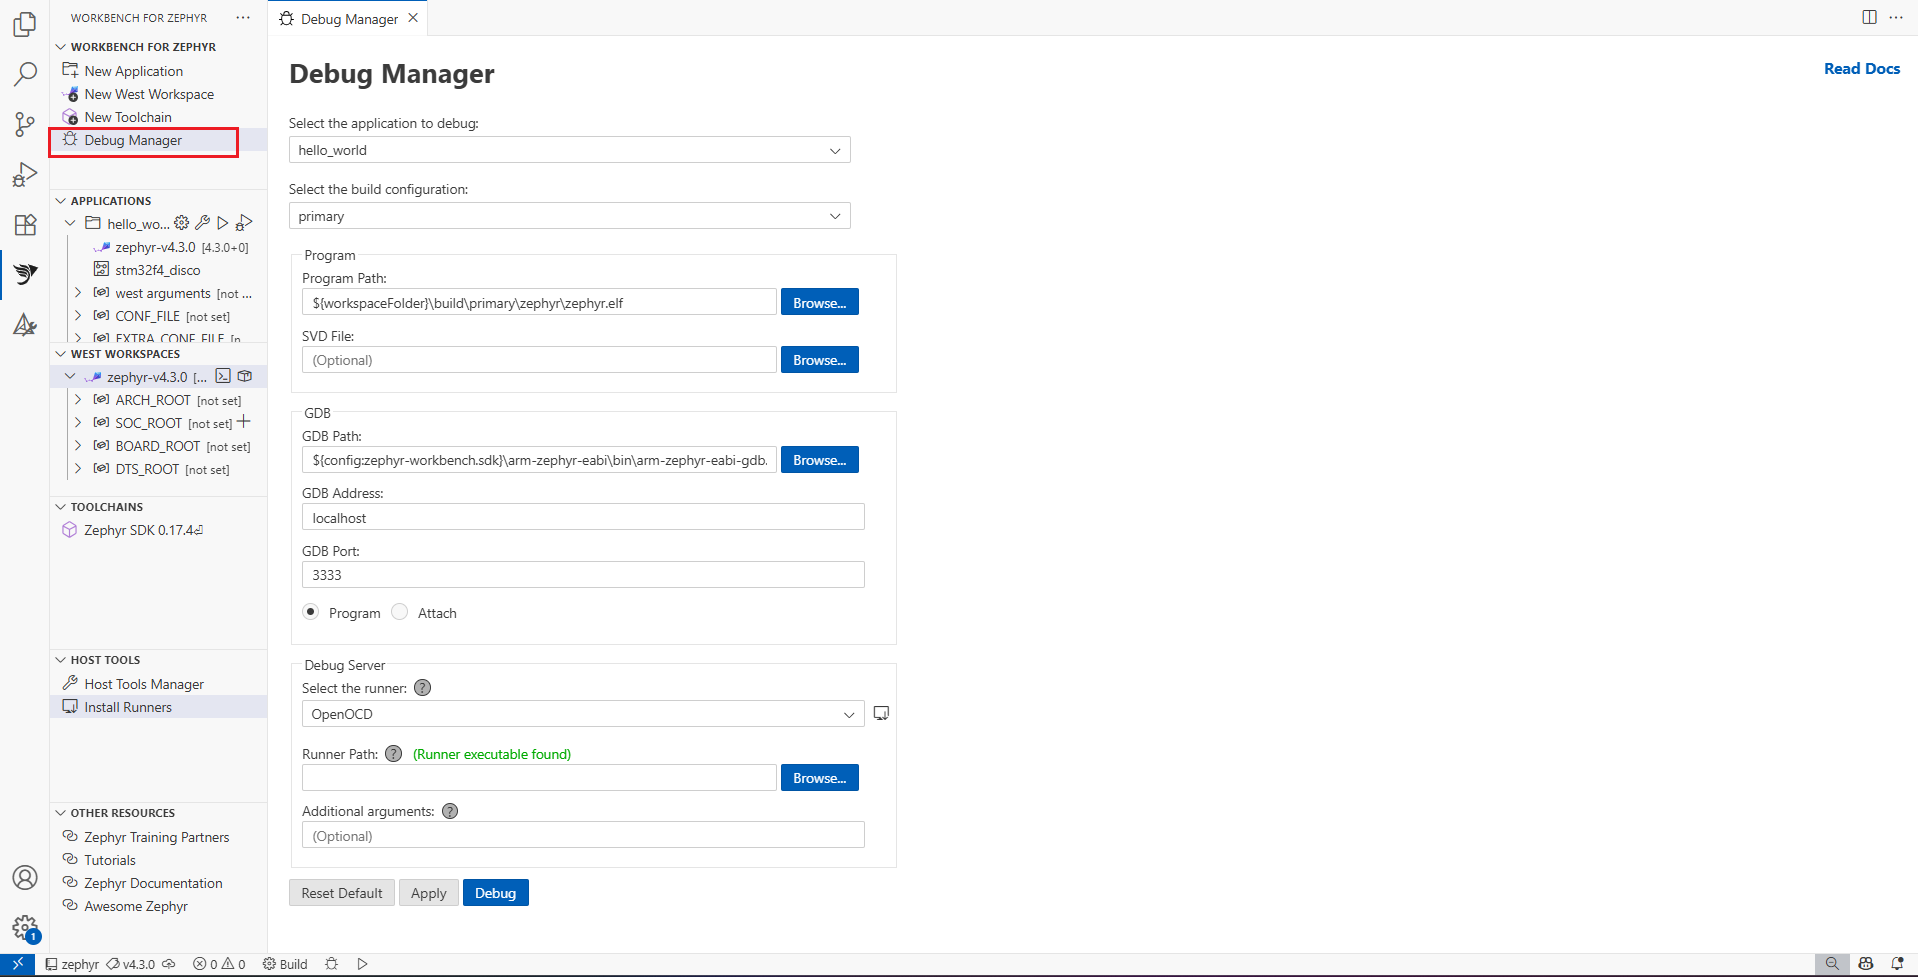
Debug the application
After starting the debug session, execution stops on main or earlier (depending on the optimization level of your project).
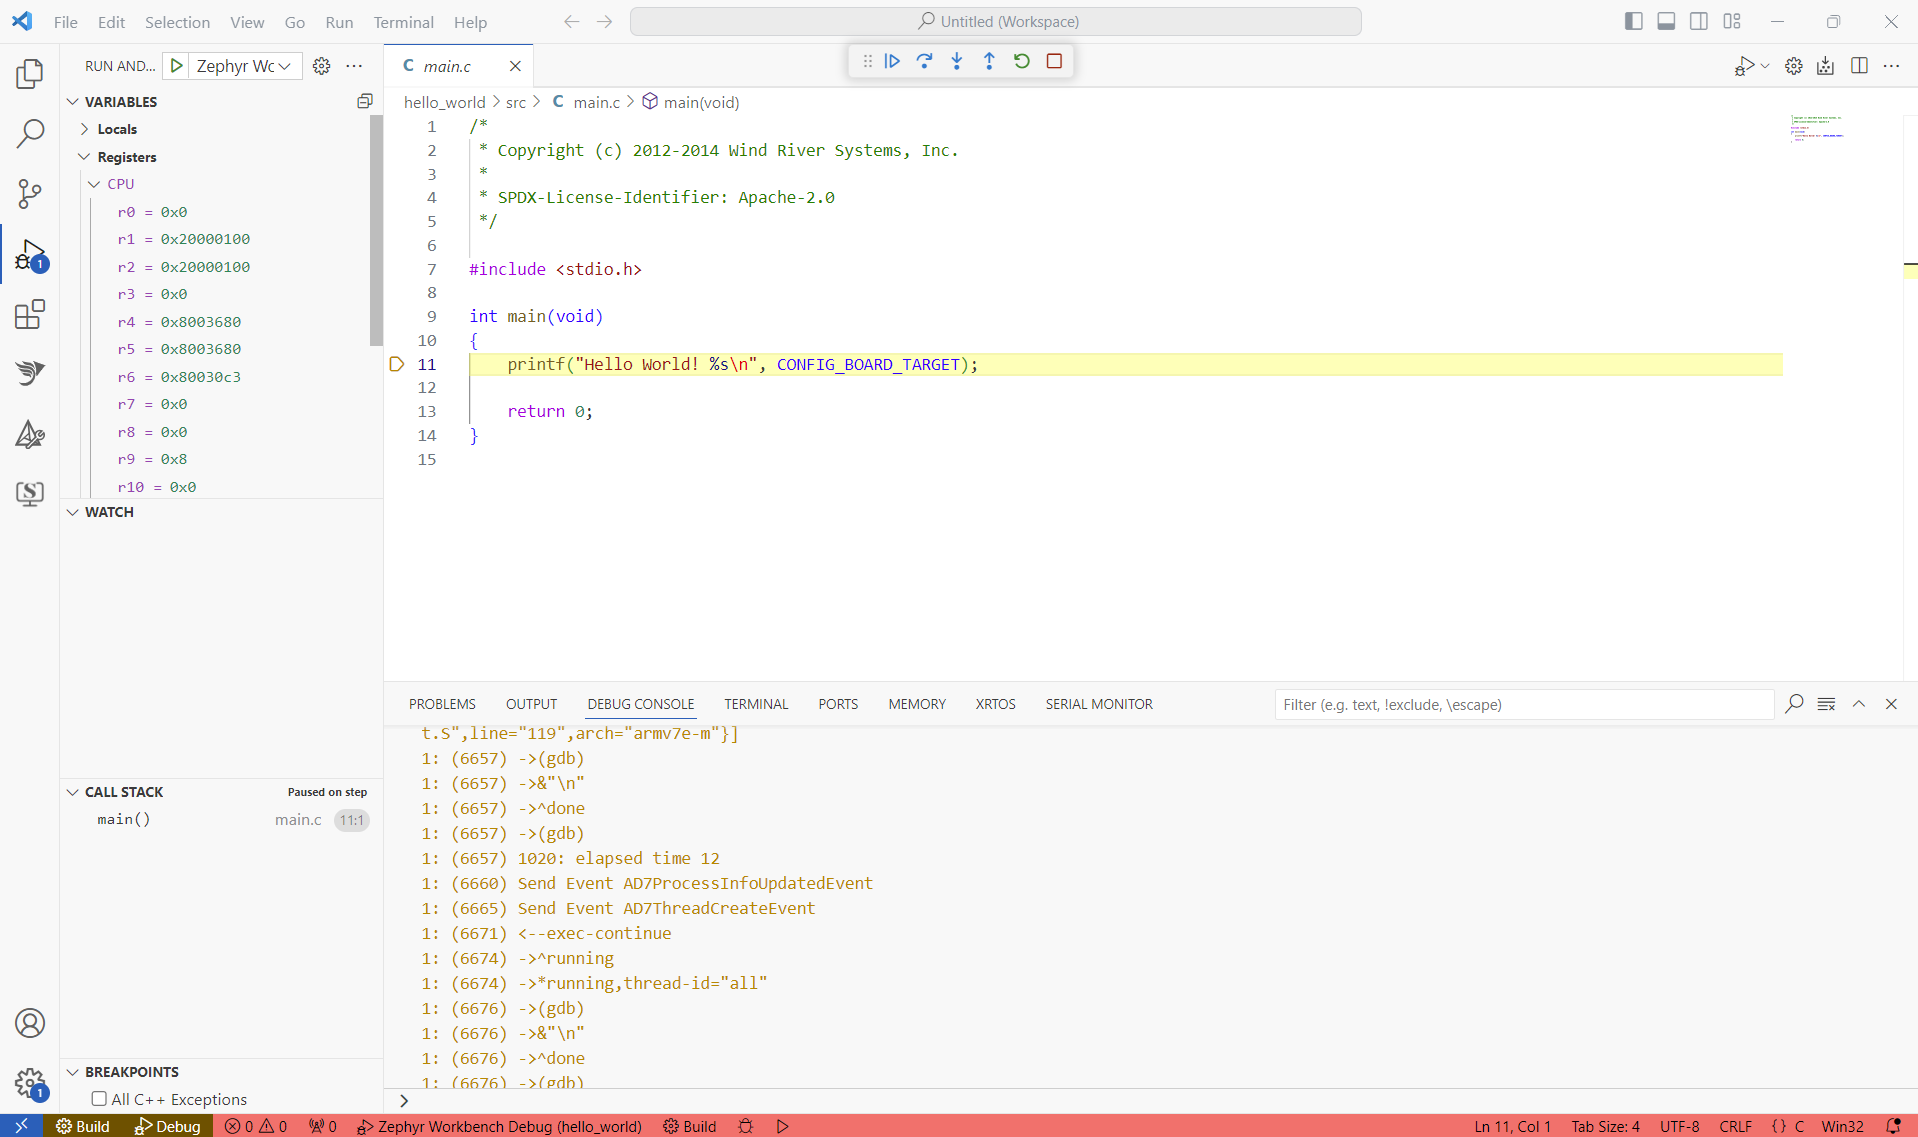
The "Debug Toolbar" allows you to Continue/Pause, Step Over, Step Into, Step Out, Restart or Stop.

More information: Debugging in VS Code
Launch the debug session
To re-run the debug, you don't have to open the "Debug Manager" again as the launch configuration is already created.
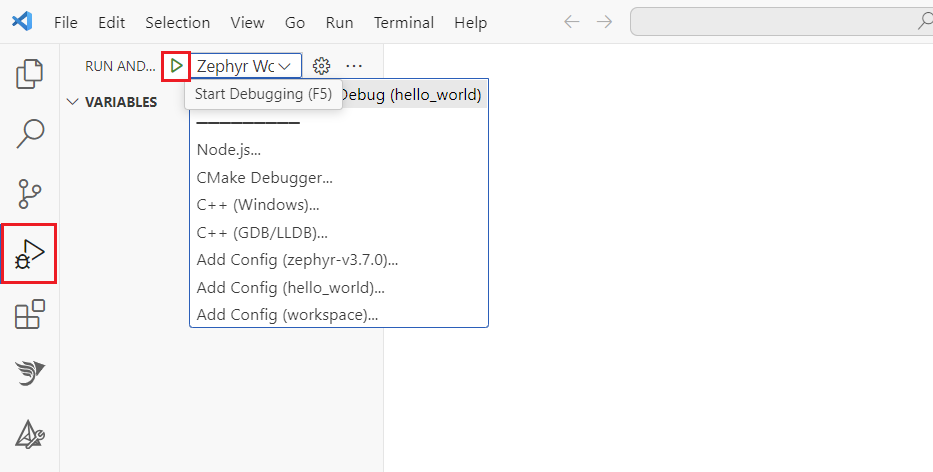
- Go to the "Run and Debug" (Ctrl+Shift+D) activity panel
- Select the launch configuration for your project
- Click on the Run button