Debug Session
Open the Debug Manager
The Debug Manager creates and updates the debug configuration for an application. To open it:
- Click on "Debug Manager" in the "Workbench for Zephyr" view, or
- Run "Zephyr Workbench: Debug Manager" from the command palette, or
- Right-click on the application > Debug: it opens the Debug Manager when no debug configuration exists yet.
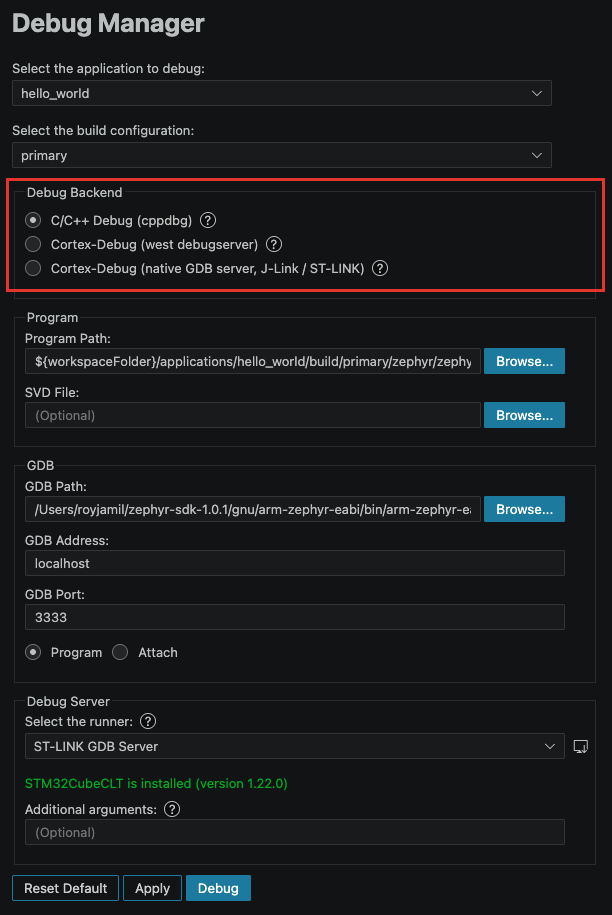
Since version 3.0.3, build and debug arguments are configured in the extension, not in .vscode/tasks.json. The extension no longer reads tasks.json. If an older project still carries debug settings there, delete the file or re-import the application, then configure the session in the Debug Manager.
Select the application
- "Select the application to debug:" pick your application.
- "Select the build configuration:" pick the configuration to debug. If the application has a single configuration, it is selected automatically.
The form then fills with default values for that build.
Build the configuration first. The Debug Manager reads the build output to detect which runners are compatible with your board and to fill the program path.
Choose the Debug Backend
The "Debug Backend" fieldset selects which VS Code debug extension drives the session:
- C/C++ Debug (cppdbg) (default): debugs with the Microsoft C/C++ extension. The GDB server is started through west.
- Cortex-Debug (west debugserver): debugs with the Cortex-Debug extension. Zephyr Workbench starts the GDB server through west for the selected runner, then attaches Cortex-Debug to it.
- Cortex-Debug (native GDB server, J-Link / ST-LINK): Cortex-Debug launches the J-Link or ST-LINK GDB server directly, without west.
When to pick which:
- Keep the default if you have no special requirement: it works with every runner.
- Pick "Cortex-Debug (west debugserver)" to use the Cortex-Debug views while keeping west in charge of the GDB server, with any runner.
- Pick the native option if you debug with a J-Link or ST-LINK probe and want Cortex-Debug to manage the GDB server itself.
The two Cortex-Debug backends require the Cortex-Debug extension. If it is missing, the Debug Manager shows "Cortex-Debug extension is NOT installed (or disabled)" with an "Install Cortex-Debug" button.
Program
- "Program Path:": the ELF image to debug. Filled automatically from the selected build.
- "SVD File:" (optional): the CMSIS-SVD file describing your device peripherals. Setting it enables the peripheral registers view during debug. For STM32 boards, it is detected automatically when STM32CubeCLT is installed.
GDB
Workbench for Zephyr uses the cross GNU Debugger (GDB):
- "GDB Path:": path to the cross GDB (by default, the GDB from the Zephyr SDK).
- "GDB Address:" and "GDB Port:": TCP/IP connection to the GDB server. The port defaults to the usual port of the selected runner (J-Link 2331, ST-LINK GDB Server 61234, others 3333).
- "Program" / "Attach": "Program" (default) loads the application on the target and debugs it. "Attach" connects to the target without loading the program.
With the "Cortex-Debug (native GDB server, J-Link / ST-LINK)" backend, the address and port fields are hidden: Cortex-Debug manages the server connection itself.
Debug Server
The debug server connects GDB to your board. In Zephyr, it is also called the runner.
- "Select the runner:": choose among OpenOCD, LinkServer, J-Link, pyOCD, and ST-LINK GDB Server.
- Runners supported by your build show a "(compatible)" suffix.
- With the native Cortex-Debug backend, only J-Link and ST-LINK GDB Server are listed.
- A status line shows whether the runner is available on your system: green "is installed (version ...)" or red "is NOT installed" with an "Install Runners" button. The download icon next to the dropdown ("Install debug runners") opens the same Install Runners page.
- "Runner Path:" (optional): overrides the runner executable found in the environment. Leave it empty in most cases.
- With OpenOCD, a "Default:" line shows which OpenOCD variant is used and its detected path. Click "Change" to select another variant from the Install Runners page.
- "Additional arguments:" (optional): extra options passed to the debug server.
To list the options a runner accepts, run this in a terminal:
west debug --runner <runner_name> -H
Cortex-Debug native options
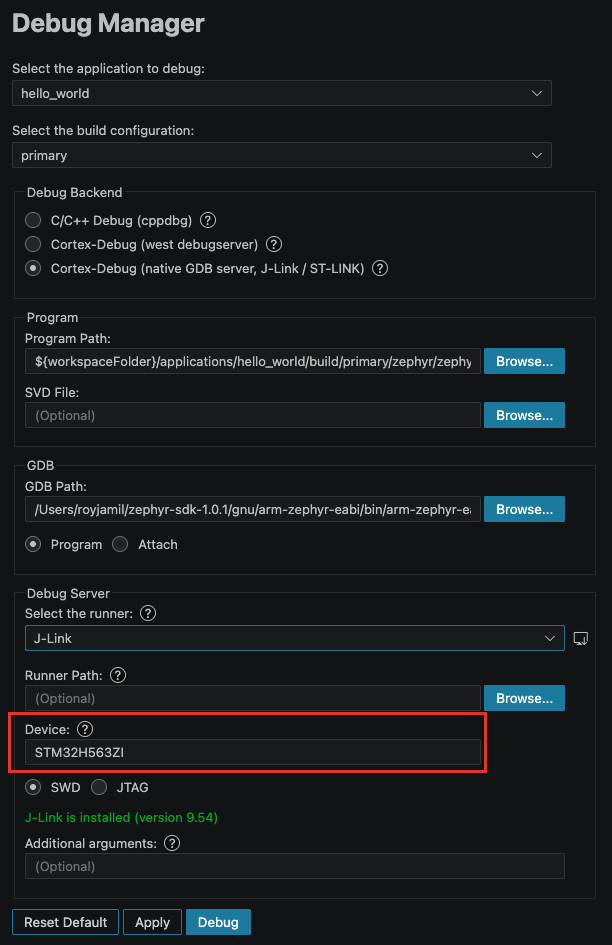
These fields appear only with the "Cortex-Debug (native GDB server, J-Link / ST-LINK)" backend:
- "Device:": the target device name passed to the GDB server (the SEGGER device name for J-Link, e.g. STM32F429ZI). It is auto-detected from the build when possible; enter it manually otherwise.
- "SWD" / "JTAG": the debug interface (SWD by default).
pyOCD target support
When pyOCD is selected, a status line tells whether pyOCD supports your target. If support is not installed, the required CMSIS-Pack is downloaded automatically when you apply or start the session, which can take a while.
Click the gear button next to the runner dropdown ("Open pyOCD Manager (CMSIS-Packs, targets)") to manage packs and targets yourself in the pyOCD Manager.
Apply and start
- "Apply" saves the debug configuration. It appears in
launch.jsonas "Zephyr Workbench Debug", followed by the build configuration name in brackets, for example "Zephyr Workbench Debug [primary]". For an application inside a west workspace, the name also includes the application, for example "Zephyr Workbench Debug: blinky [primary]". - "Debug" applies the configuration, then starts the session.
- "Reset Default" restores the default values for the selected backend and runner.
The runner selected here is used for debugging only. The runner used for flashing is set separately: see Flash and Run.
Start debugging
To start the debug session, click on "Debug" in the Debug Manager.
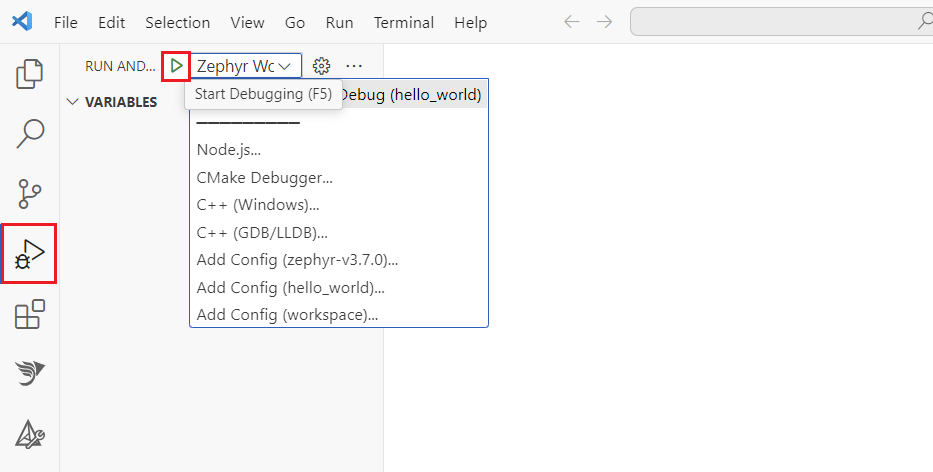
Once the configuration exists, you can also start it from the VS Code Run and Debug view:
- Go to the "Run and Debug" (Ctrl+Shift+D) activity panel
- Select the "Zephyr Workbench Debug" configuration for your project
- Click on the Run button
Debug your application
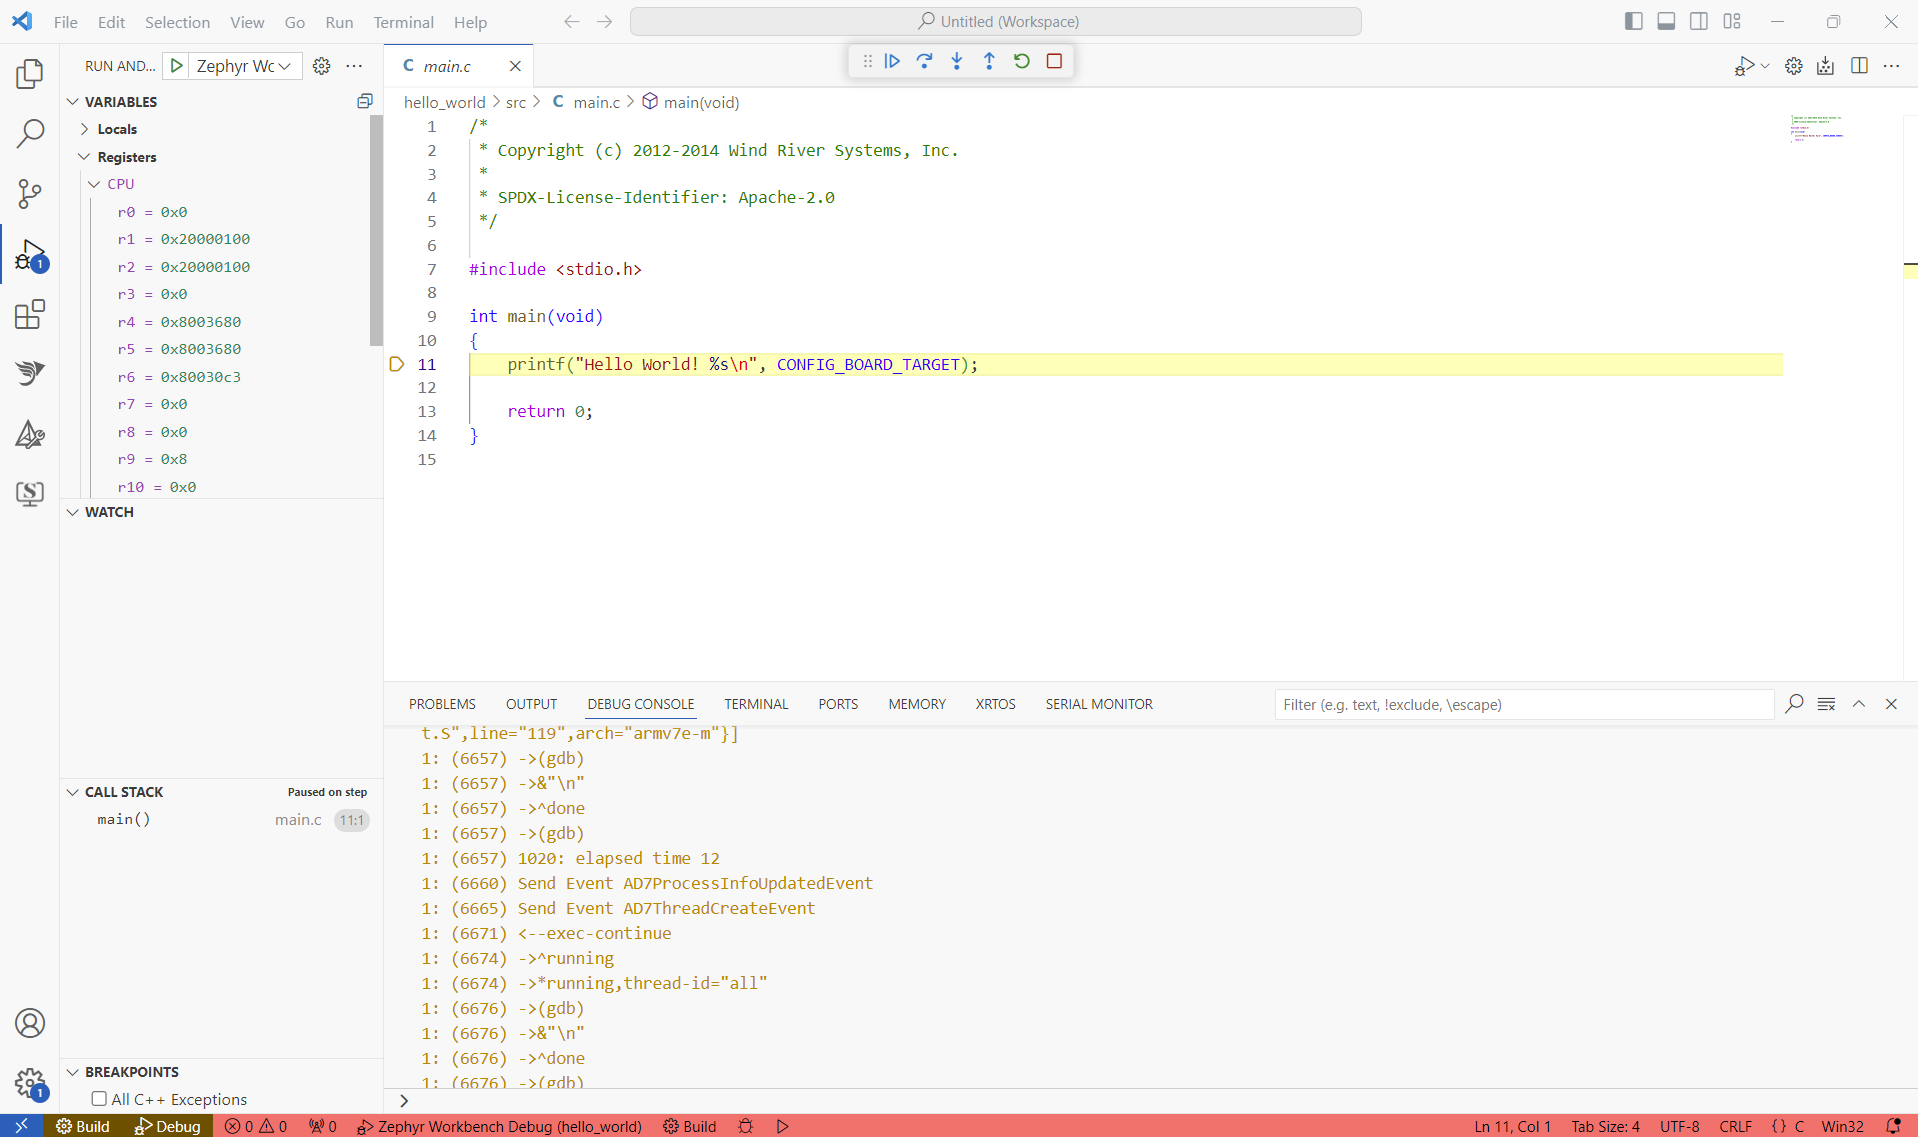
After starting the debug session, the code should break on main or earlier (depends on optimizations set up for your project).
Debug actions
The "Debug Toolbar" appears on the top and allows you to:

| Action | Explanation |
|---|---|
Continue/Pause F5 | Continue: Resume normal program/script execution (up to the next breakpoint). Pause: Inspect code executing at the current line and debug line-by-line. |
Step Over F10 | Execute the next method as a single command without inspecting or following its component steps. |
Step Into F11 | Enter the next method to follow its execution line-by-line. |
Step Out Shift+F11 | When inside a method or subroutine, return to the earlier execution context by completing remaining lines of the current method as though it were a single command. |
Restart Ctrl+Shift+F5 | Terminate the current program execution and start debugging again using the current run configuration. |
Stop Shift+F5 | Terminate the current program execution. |
Data inspect
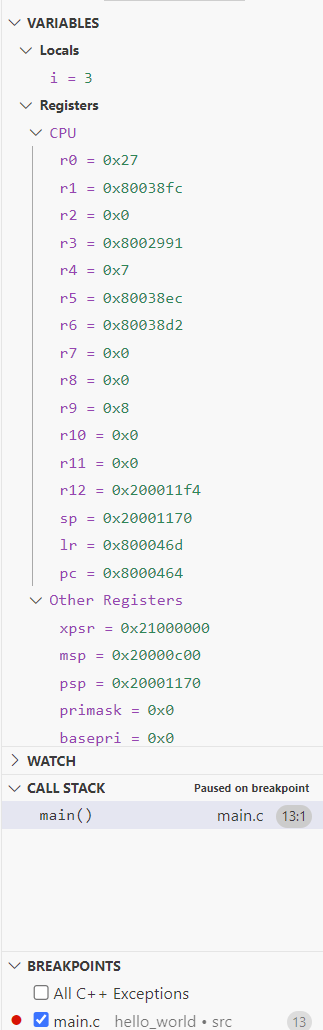
Inspect variables and CPU registers on the left panel
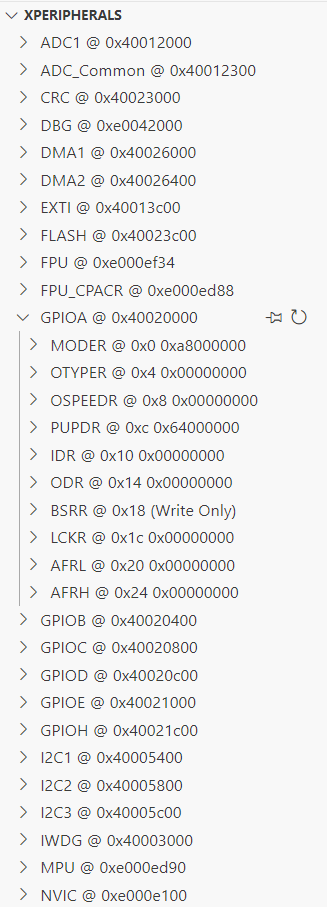
If the SVD file was set in the debug configuration, the peripherals are displayed in the "xperipherals" view.
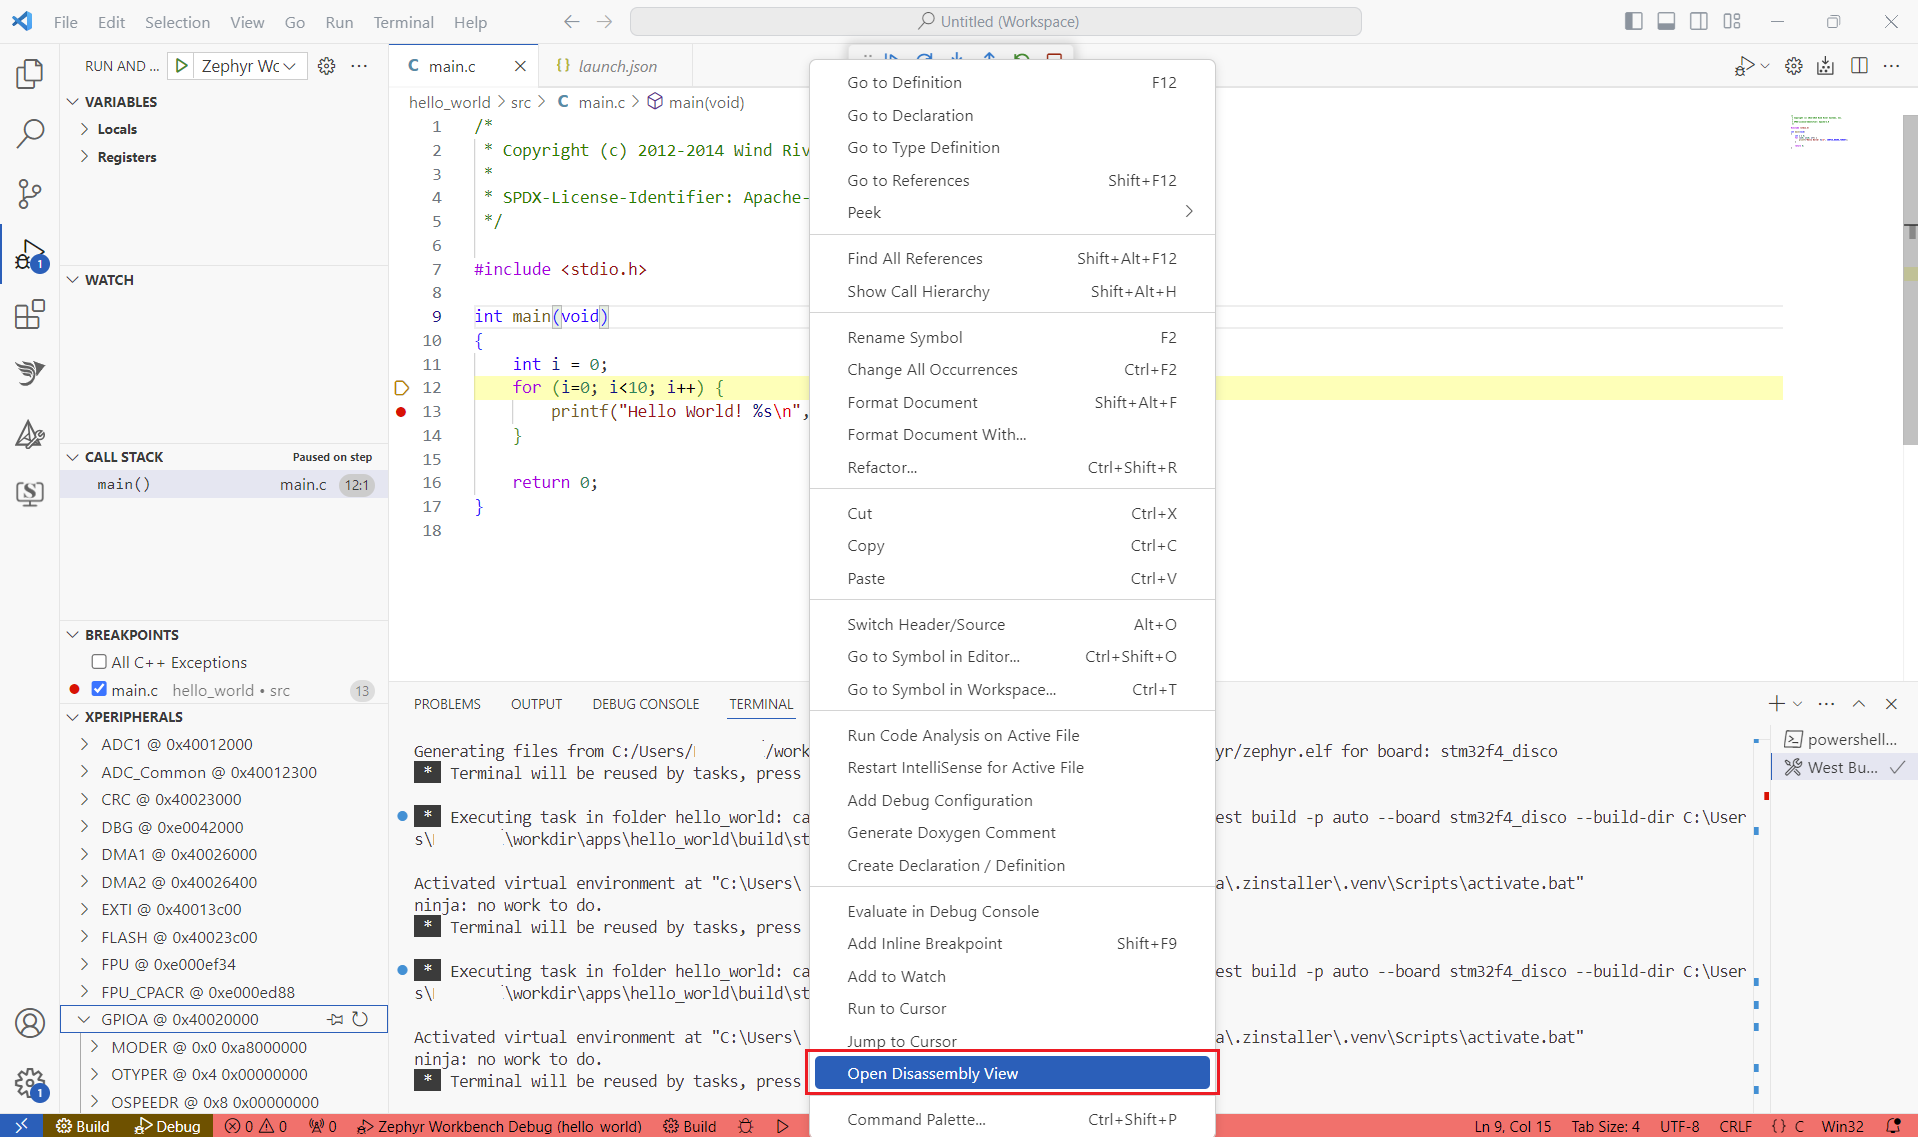
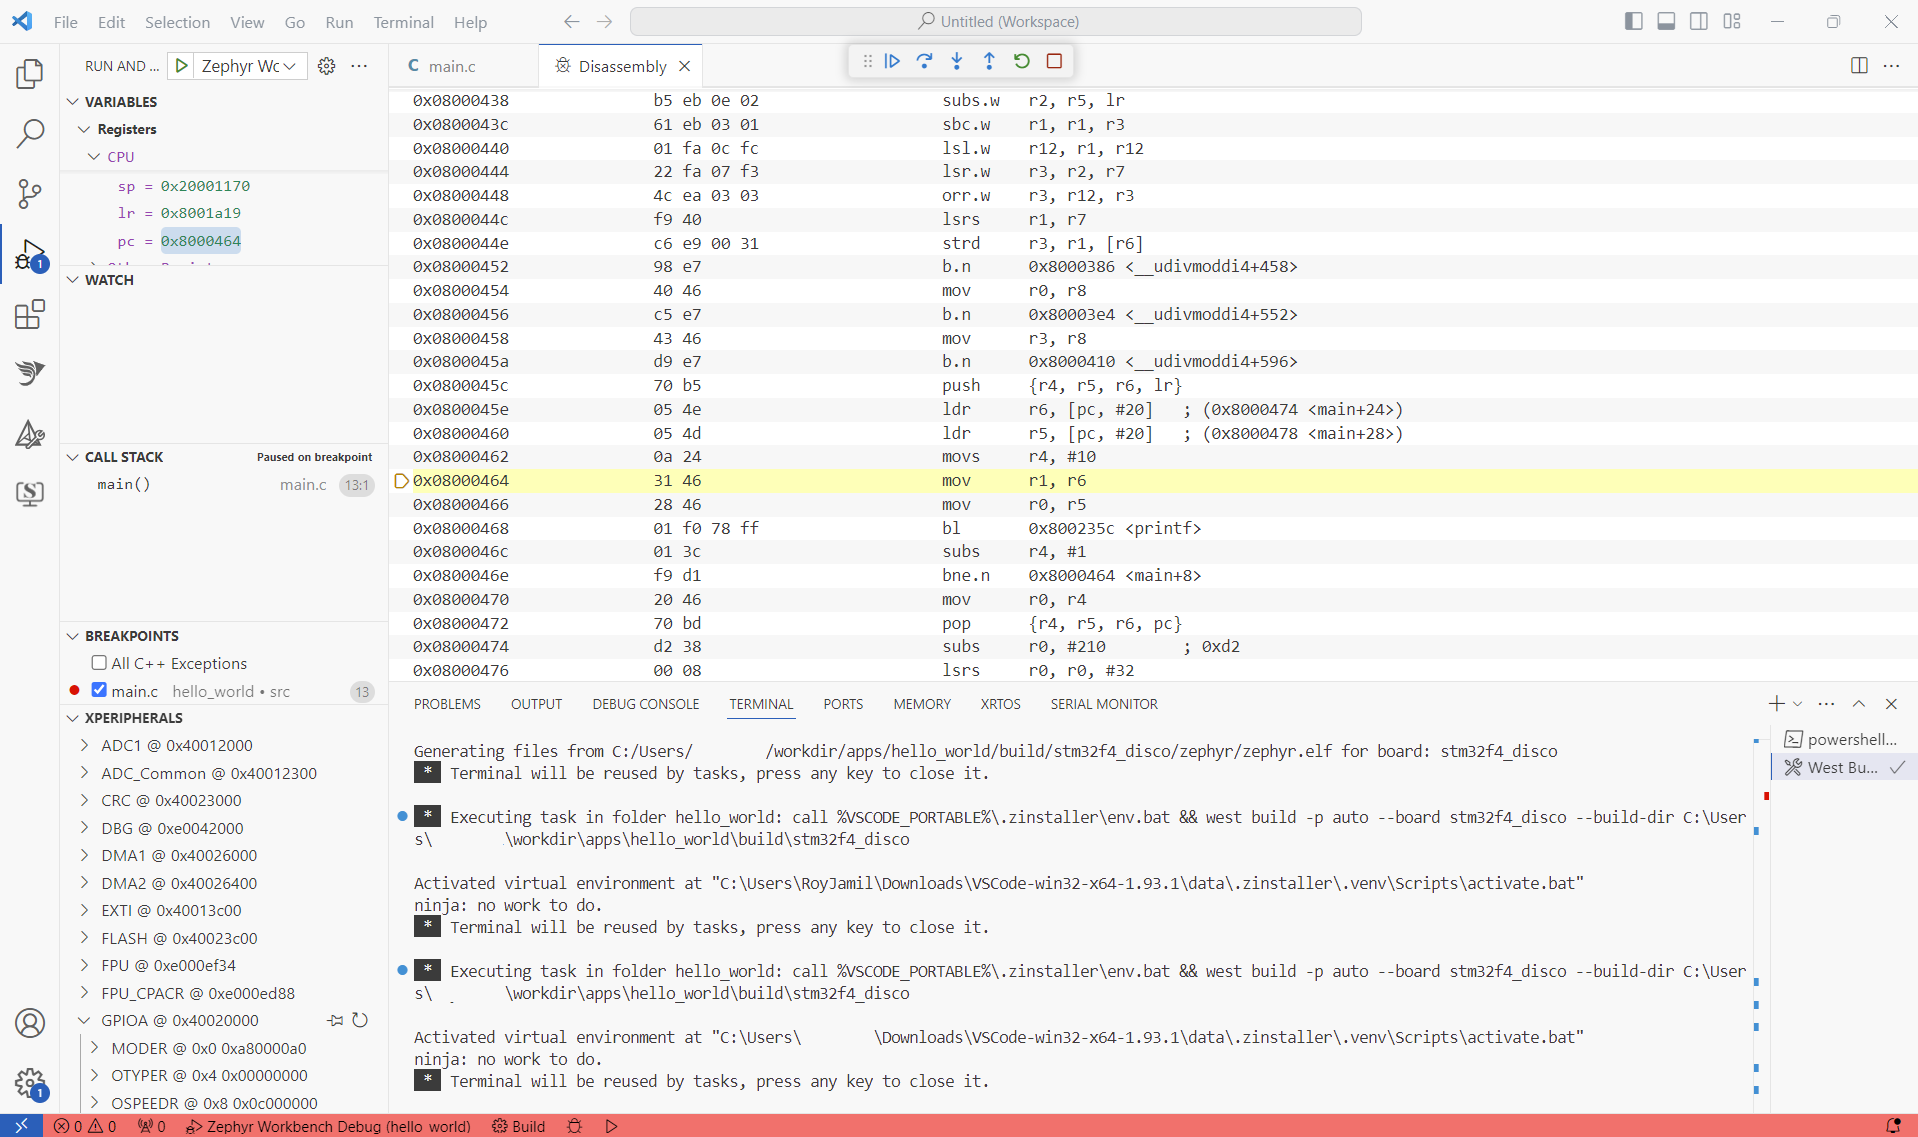
To debug in disassembly, right-click on the code then select "Open Disassembly View".
More information about Debugging on VSCODE